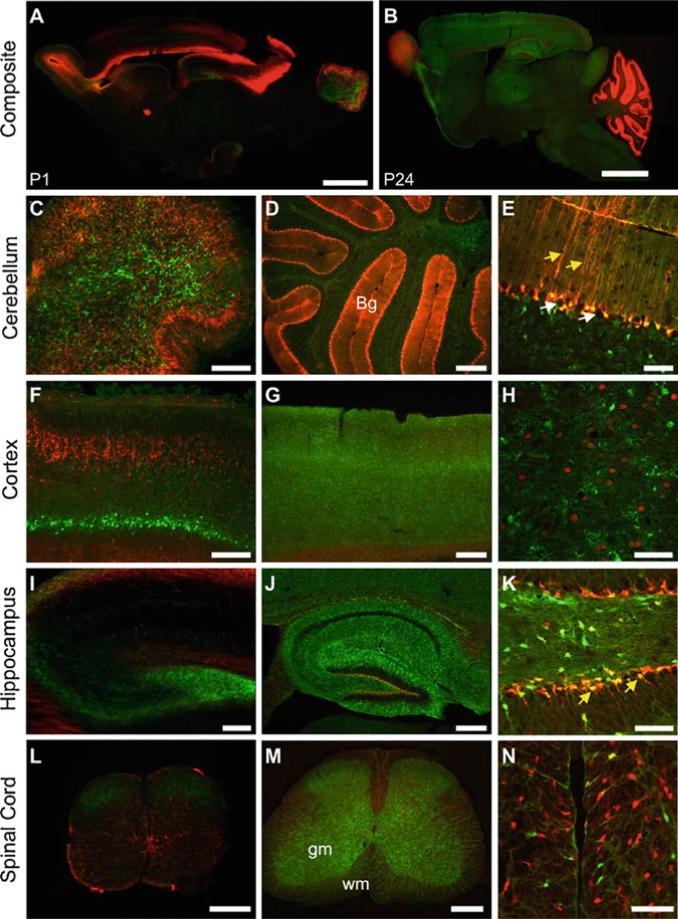
Fig. 3.
Astrocytic expression of glutamate transporters varies in different areas of the CNS. Double-transgenic mice expressing fl orescent proteins under the GLAST and GLT-1 promoters were used to study the expression of GLAST and GLT-1 during development of the CNS. All images are sagittal sections from GLAST–DsRed/GLT-1–eGFP double-transgenic mice. (a) Composite fluorescent image showing the expression of DsRed (GLAST) (red) and eGFP (GLT-1) (green) in the brain at P1. (b) Composite image showing the expression of DsRed (GLAST) and eGFP (GLT-1) in the P24 brain. (c–e) Fluorescent images of the cerebellum at P1 (c) and P24 (d, e). Both GLAST and GLT-1 promoters were active in Bergmann glia (Bg) (yellow arrows in (e)), although neither promoter was active in Purkinje neurons (white arrows in (e)). (f–h) Fluorescent images of the cortex from P1 (f) and P24 (g, h). Layer 4 is shown at higher magnification in (h). (i–k) Fluorescent images of the hippocampus from a P1 (i) or P24 (j, k). Both DsRed (GLAST) and eGFP (GLT-1) were expressed by radial glia in the dentate gyrus (yellow arrows in (k)). (l–n) Fluorescent images of spinal cord from a P1 (l) or P24 (m, n). gm gray matter; wm white matter. A region of the ventral white matter is shown at a higher magnification in (n). Scale: (a–b) 2 mm; (c, d) 300 μ m; (e) 50 μ m; (f, g) 300 μ m; (h) 50 μ m; (i, j), 300 μ m; (k) 50 μ m; (l, m) 300 μ m; (n) 50 μ m. From (55).

