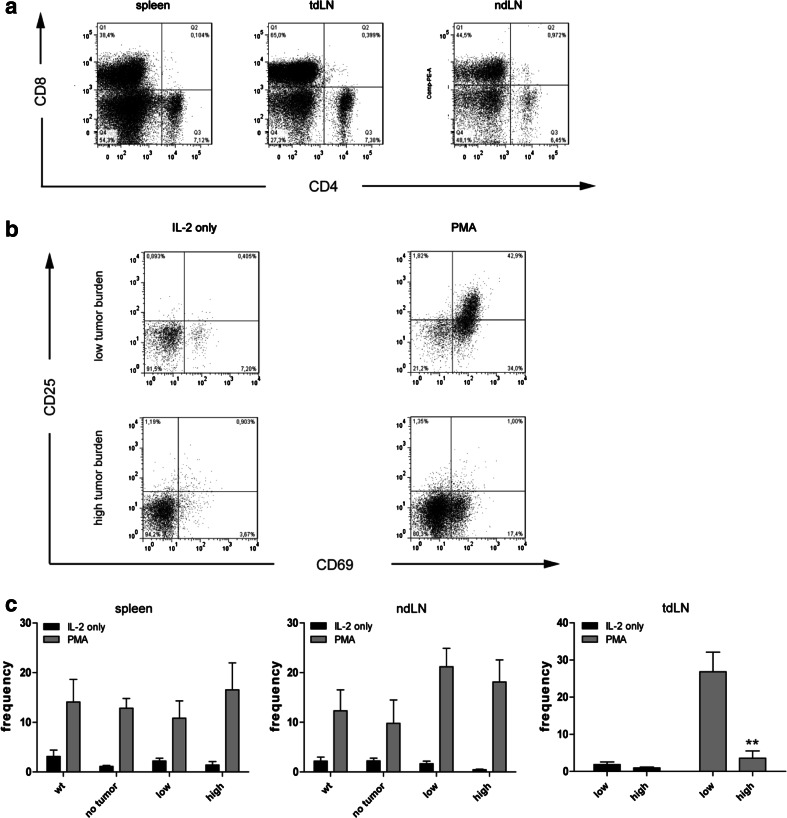
Fig. 4.
Frequency of CD4+ and CD8+ T cells upon IL-2 and PMA stimulation. a Representative dot plots of CD4 and CD8 stainings in spleen, tumor-draining (tdLN), and non-draining (ndLN) lymph nodes of a high tumor burden LLA-TG-3 mouse upon IL-2/PMA stimulation; b representative flow cytometry analysis of gated CD8+ T cells in tumor-draining LN of low and high tumor burden LLA-TG-3 mice upon stimulation with IL-2 (500 IU/ml) or IL-2 and PMA (200 nM). Numbers in top right quadrants indicate CD69+CD25+ cells; c the frequency of CD69+/CD25+ CD8+ T cells in spleen, tdLN, and ndLN of wt and LLA-TG-3 mice was analyzed as in a; n = 10 for wt mice; n = 6 for no tumor and low tumor burden LLA-TG-3 mice; n = 8 for high tumor burden LLA-TG-3 mice. Depicted are mean values + SEM. **p < 0.005

