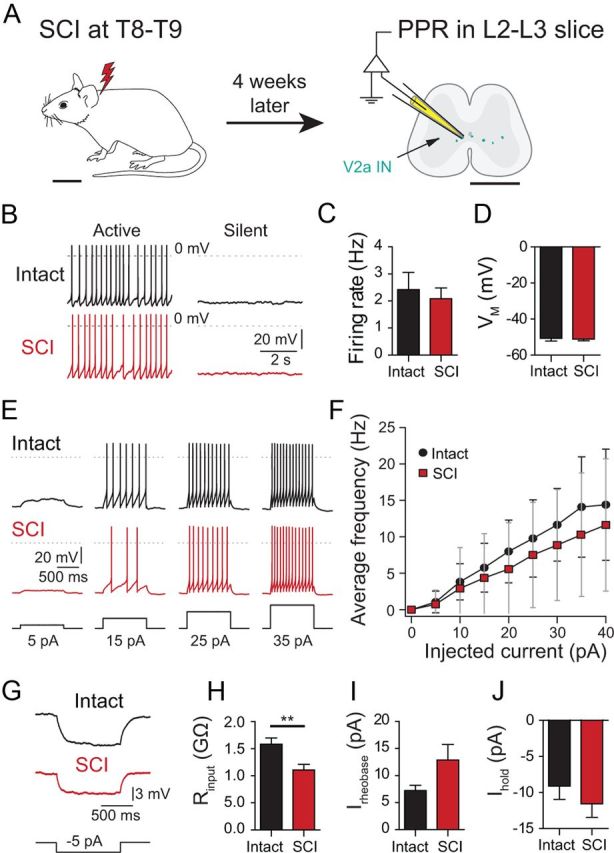
Figure 1.

V2a INs do not become hyperexcitable 1 month after SCI. A, Schematic showing the location of the SCI in the mouse, and the approximate recording site in spinal cord slices. B, Active and silent neurons in both intact and SCI slices. C, Average firing frequency of spontaneously active cells in intact and SCI neurons (n = 10–21). D, Average membrane potential (EM) of silent or weakly firing intact and SCI neurons (n = 11–18). E, Responses of intact and SCI V2a INs to increasing current pulses from a holding potential of −60 mV. F, F/I plot of firing frequency as a function of depolarizing current step amplitude (n = 17, for each point). G, Measurement of input resistance by measuring voltage deflection caused by small hyperpolarizing current injections from −60 mV. H, Significantly lower mean input resistance in SCI neurons compared with intact cells (n = 20–29). I, Rheobase values (Irheobase) in intact and SCI neurons (n = 20–29). J, Mean holding current (Ihold) at −60 mV for intact and SCI neurons (n = 20–29). Scale bars: A, left 1 cm, right 1 mm. **p = 0.005. Bars represent the mean. Error bars indicate SEM.
