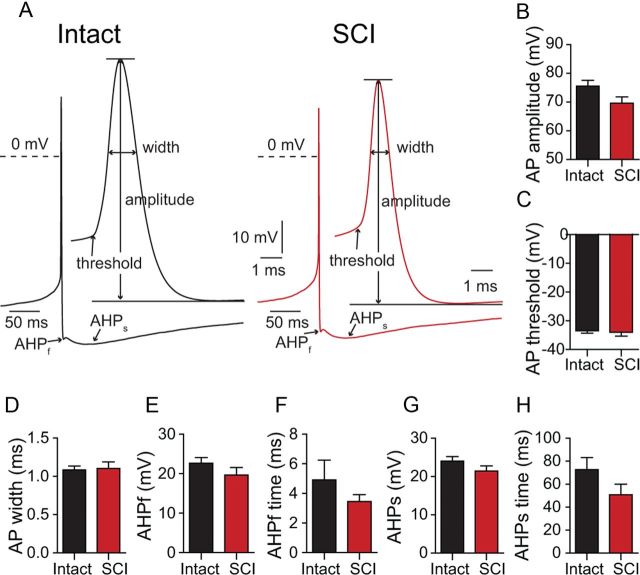
Figure 2.
AP properties of intact and SCI V2a INs. A, Typical APs (signal-averaged by aligning peaks from 10–12 APs) from intact and SCI cells at two different time scales illustrating the waveform parameters analyzed. B–H, Comparisons of AP amplitude (B), AP threshold (C), AP half-width (D), AHPf (E), and its time course (F), and slow sustained AHPs amplitude (G) and time course (H). Data in B–H are means from 20 independent experiments in each group. Bars represent the mean. Error bars indicate SEM.

