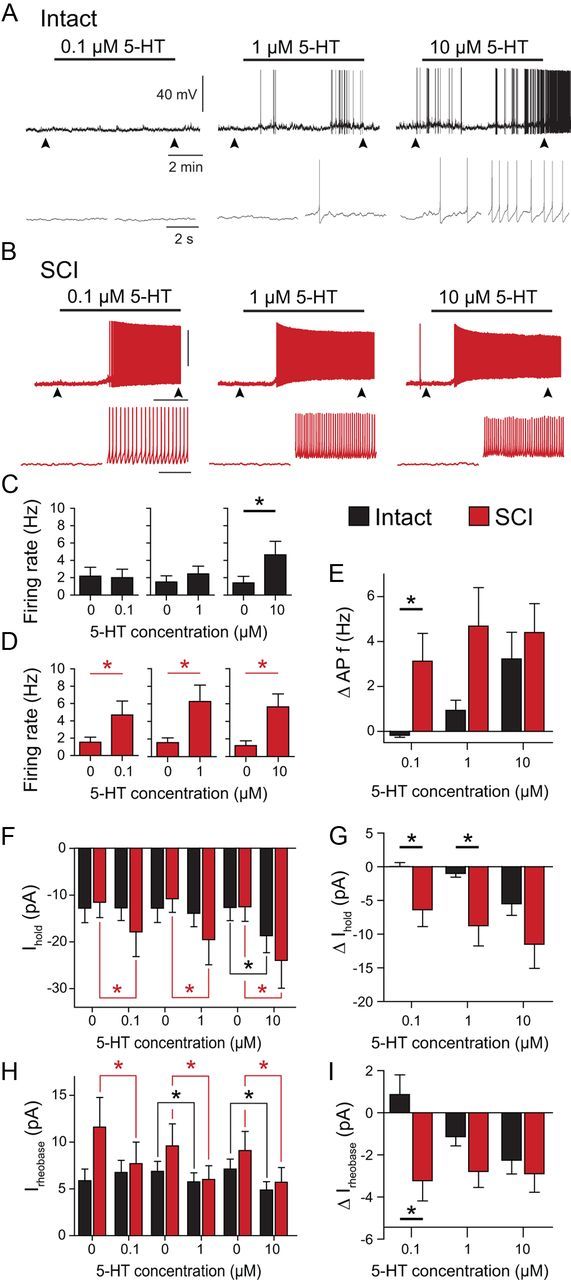
Figure 3.

Enhanced serotonin (5-HT) sensitivity of V2a INs 4 weeks after SCI. A, B, Spontaneous firing activity of a typical intact neuron (A) and SCI neuron (B) during application of increasing 5-HT concentrations. Arrowheads indicate time of expanded time scale insets below. C, D, Average AP frequency of intact (C) and SCI (D) neurons at different 5-HT concentration. E, Change in AP frequency (intact: n = 7; SCI: n = 8). F, Average holding currents (Ihold) at different 5-HT concentration applications in intact and SCI cells. G, Change in holding current to hold the membrane potential at EM = −60 mV (intact: n = 10; SCI: n = 10). H, Average rheobase values at different 5-HT concentration applications in intact and SCI cells. I, Change in rheobase, the current needed to elicit an AP at EM = −60 mV (intact: n = 8; SCI: n = 9). *p < 0.05.
