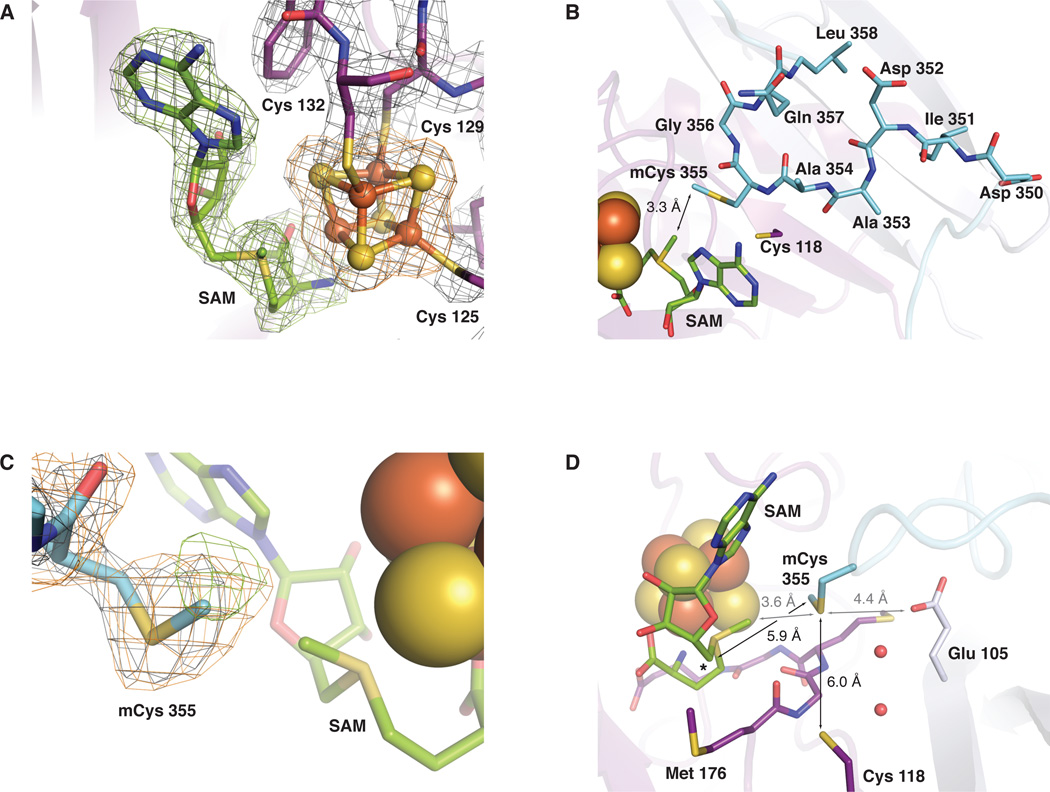
Fig. 2.
Selected views of the RlmN active site. (A) 2Fo-Fc electron density map (gray mesh, 1.5σ) for residues 125–132 (containing the CX3CX2C motif), the [4Fe-4S] cluster, and the SAM cosubstrate in the RlmN+SAM structure. An omit map contoured at 3.0σ for SAM (green mesh) and the [4Fe-4S] cluster (orange mesh) is superimposed. (B) A top-down view of the highly conserved 351–360 linker region as modeled in the RlmN+SAM structure. The linker is represented in stick format colored by atom type. A loop (residues 310–320) located in front of the SAM cofactor is omitted for clarity. (C) 2Fo-Fc electron density map (gray mesh, 1.0σ) for residue 355 in the RlmN+SAM structure. Omit maps for the S-methyl group of residue 355 (green mesh, 2.2σ) and the entire residue (orange mesh, 1.9σ) are superimposed. (D) A side view of the active site. The conserved MGMGE sequence motif in the α6/β6 core is shown in stick format and colored by atom type. Selected conserved residues and ordered water molecules are shown as sticks and spheres, respectively. The 5’ position of the SAM cosubstrate is denoted by an asterisk. Distances relevant to the methyl transfer reaction are drawn as gray lines and those relevant to mCys 355 activation and disulfide formation are shown as black lines.

