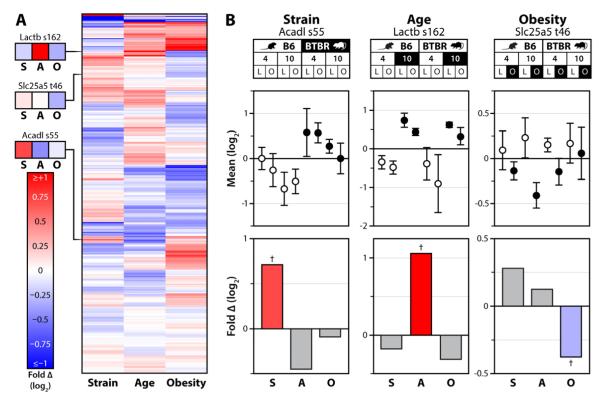
Figure 3. State-specific mitochondrial phosphorylation.
A) Heat map showing unsupervised hierarchical clustering of all quantified mitochondrial phosphoisoforms across each single-variable comparison; strain (S), age (A) and obesity (O). Values are fold changes between all mice differing by the indicated variable, on a log2 scale from <-1 to >1. B) Top: 8-plex iTRAQ-based quantification of phosphorylation of Acadl serine 55, Lactb serine 162, and Slc25a5 threonine 46 is shown for each condition (with error bars representing SD from all replicates quantified) relative to the average of all eight conditions. Bottom: The same data analyzed with relative abundance reflecting the fold-change (log2 scale) between all 40 mice of the multivariate experiment separated by one variable at a time (e.g., strain analysis represents all 20 B6 mice vs. all 20 BTBR mice). The colored bars correspond to the comparisons, with the data points highlighted in black on the top panel serving as the numerator and those in white as the denominator. Crosses (†) indicate significance at q<0.1.

