
FIG. 5.
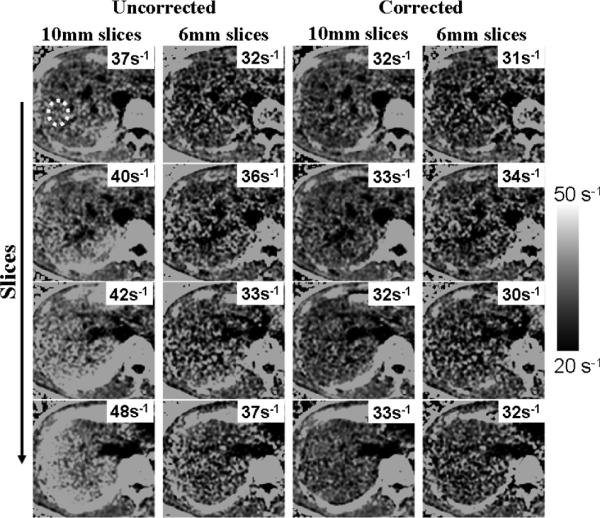
Liver R*2 maps from a healthy volunteer, obtained using a 2D acquisition with 10-mm slices. (Left) Uncorrected. (Right) Corrected. Average R*2 was measured from the area inside the yellow dots (the same region-of-interest was measured in all slices for both reconstructions). Note the increase in apparent (uncorrected) R*2 values as slices approach the dome of the liver. Susceptibility-corrected R*2 remains nearly constant throughout all slices.