
FIG. 6.
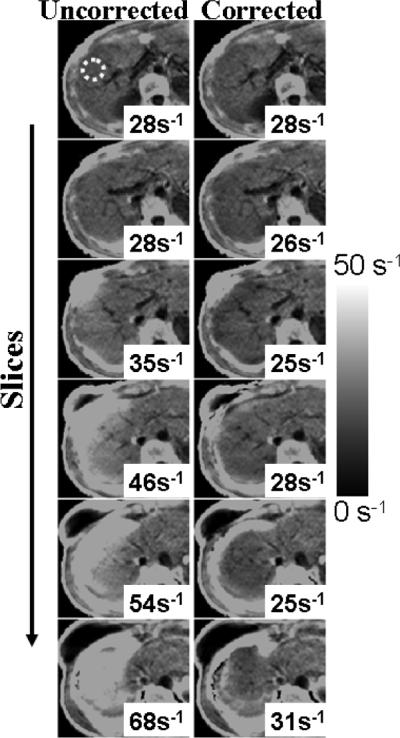
Liver R*2 maps from a healthy volunteer, obtained using a 3D acquisition with 10-mm slices. (Left) Uncorrected. (Right) Corrected. Note the increase in apparent (uncorrected) R*2 values as slices approach the dome of the liver. Susceptibility-corrected R*2 remains nearly constant throughout all slices.