
FIG. 7.
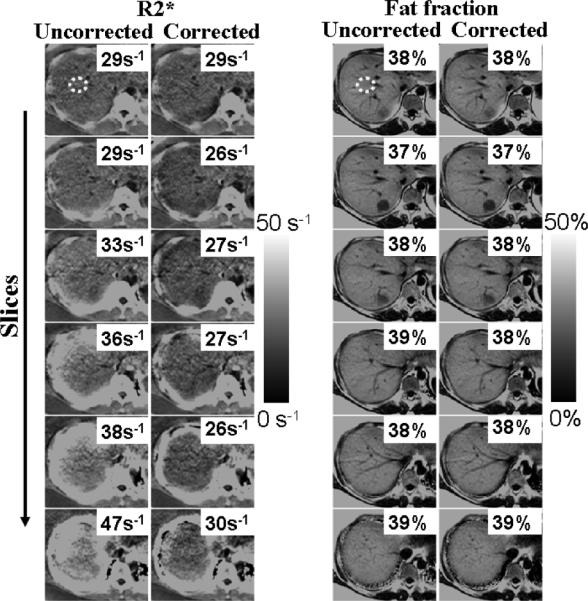
Liver R*2 and fat fraction maps from a patient with high liver fat, obtained using a 3D acquisition with 10 mm slices. R*2 maps are affected by macroscopic field variations, which is largely corrected using the proposed technique. However, in this case, fat fraction measures appear almost constant even in the presence of field variations and require no correction.