
Fig. 3.
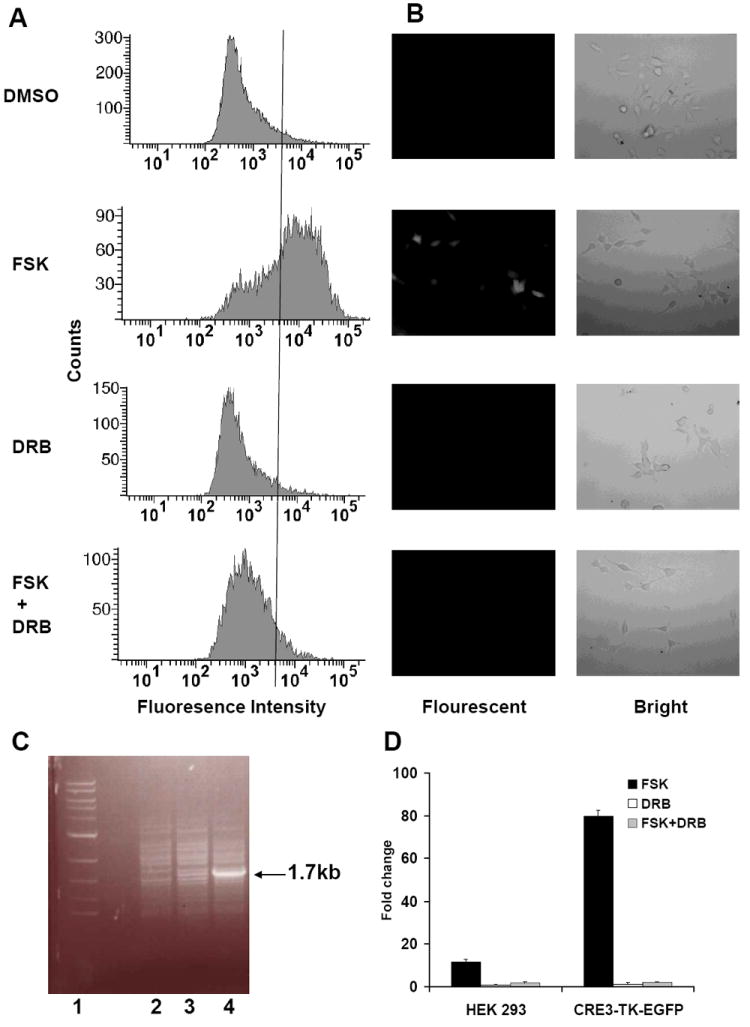
Characterization of the CRE3-TK-EGFP stable cell line. The cells were treated with either DMSO, 10 μM forskolin (FSK), 100 μM DRB or 10 μM forskolin and 100 μM DRB (FSK + DRB) for 6 hours and subjected to fluorescence-activated cell analysis (A) or observed under an inverted fluorescent microscope (B). In (A), a line is drawn crossing the 4 × 10³ tick of the x-axis. In (B), the left photos are from the fluorescent field while the right ones are from the bright field. The reporter DNA integration was verified by a PCR on the genomic DNA (C). Lane 1 is the DNA marker; lanes 2, 3 and 4 are the PCR products from the HEK 293 cells, one of the resulting stable cell clones not responsive to forskolin stimulation and the CRE3-TK-EGFP cell line, respectively. An extra 1.7kb band in lane 4 represents the reporter gene. Luciferase assays were also performed on the CRE3-TK-EGFP cells as well as the HEK 293 cells and the fold changes after 10 μM forskolin, 100 μM DRB or 10 μM forskolin and 100 μM DRB stimulation are shown (D).