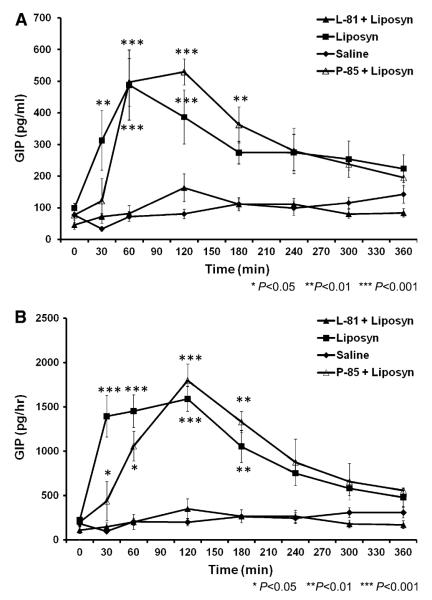
Fig. 4.
a Concentrations of GIP in lymph following intraduodenal infusions of Liposyn (filled boxes), L-81 plus Liposyn (filled triangles), P-85 plus Liposyn (open triangles) or saline (filled diamonds). Data are presented as means ± SEM. Asterisks denote significant differences between the saline group and the Liposyn or P-85 plus Liposyn group, respectively, at that time. *P < 0.05, **P < 0.01, ***P < 0.001. b LymphaticGIP secretion rate in response to saline (filled diamond) or isocaloric and isovolumetric treatment of Liposyn (filled box), L-81 plus Liposyn (filled triangle) or P-85 plus Liposyn (open triangle). Data are means ± SEM. Asterisks indicate significant differences between values of the saline group and the Liposyn or P-85 plus Liposyn group, respectively, at that time: *P < 0.05, **P < 0.01, ***P < 0.001

