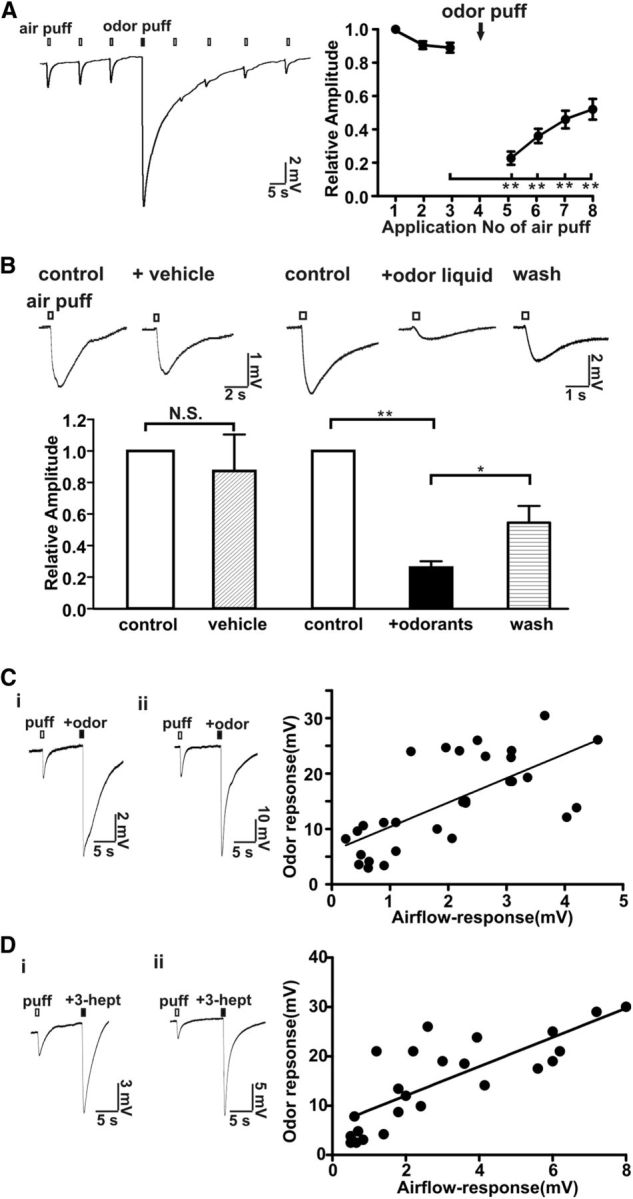
Figure 5.

Odorants reversibly desensitized the MOE to airflow. A, Application of an odorant mix applied via air puff (2.4 L/min, 200 ms) reversibly desensitized the airflow-sensitive response. Left, Representative trace of EOG responses. Right, Plot of normalized airflow-sensitive response versus application of the air puff; n = 12, **p < 0.01 (before odor stimulation vs after odor stimulation). B, A liquid odorant mix directly applied to the MOE reversibly inhibited the airflow-sensitive EOG response (2.4 L/min for 200 ms). The vehicle for the odorant mix did not change the airflow response. Washes with Ringer's solution partially reversed the inhibitory effect of the odorant solution. Top, Representative traces. Bottom, Bar graph of data; n = 8, **p < 0.01; *p < 005, paired Student's t test. C, D, Correlation between airflow-sensitive and odorant responses. The airflow-sensitive EOG response was first examined using an air puff (2.4 L/min, 200 ms) and then the odorant mixture was applied by air puff (2.4 L/min, 200 ms) using a mixture of odorants (see Materials and Methods; 50 μm each; C) or using a single odorant, 3-heptanone (500 μm; D) applied to the same location. Left, Two representative EOG traces recording in the MOE showing both airflow and odor responses. Note the y-axis scale bar distinctions. Right, Scatter plot of odor response versus airflow-sensitive response obtained from 27 different mice (C) or from 16 different mice (D). The linear equations obtained by linear regression were Y = 4.4 * X + 6.6 (C) and Y = 2.9 * X + 6.1 (D); Pearson test of correlation analysis: p < 0.001 (two-tailed), both C and D; r = 0.7 (C) and r = 0.86 (D).
