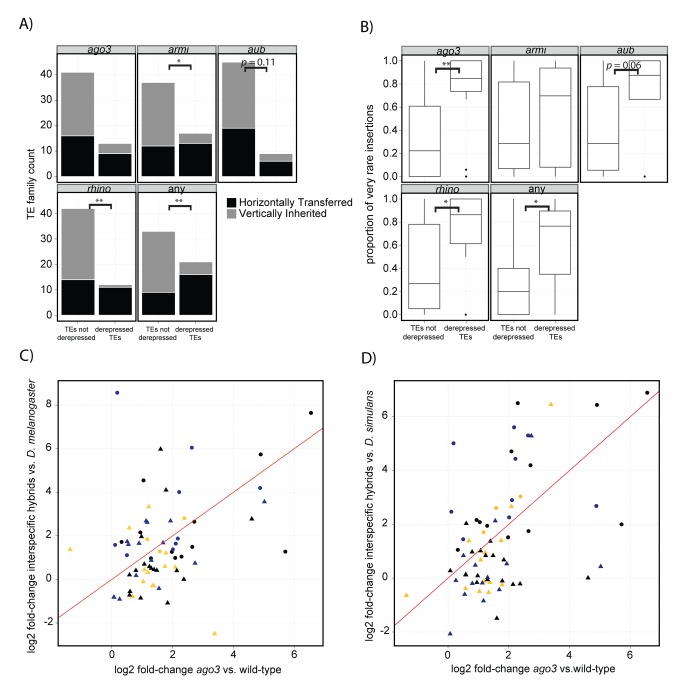
Figure 3. TE activity in interspecific hybrids phenocopies piRNA pathway mutants.
(A) TE families derepressed in four piRNA pathway mutants are enriched for candidates for recent horizontal transfer [10],[12]. Significance of comparisons between derepressed TE families and nonderepressed TE families was determined by a G-test of independence. “Any” category considers all TE families derepressed in one or more of the four mutant backgrounds. Derepressed TE families are from [44],[45]. (B) TE families derepressed in four piRNA pathway mutants exhibit a higher proportion of insertions segregating at very low frequency [52],[53]. Statistical significance was assessed by a Wilcoxon Rank Sum Test. (C and D) Changes in TE activity in interspecific hybrids versus D. melanogaster (C) and D. simulans (D) correlate with changes in TE activity in ago3 mutants versus wild-type D. melanogaster [45]. Color of TE classes is from Figure 1C and suggests that these correlations are independent of interspecific differences in the piRNA pool. Circles and triangles represent TE families derepressed and nonderepressed, respectively, in interspecific hybrids (Figure 1A). Red line indicates the best fit regression line. * p<0.05. ** p<0.01. *** p<0.001.

