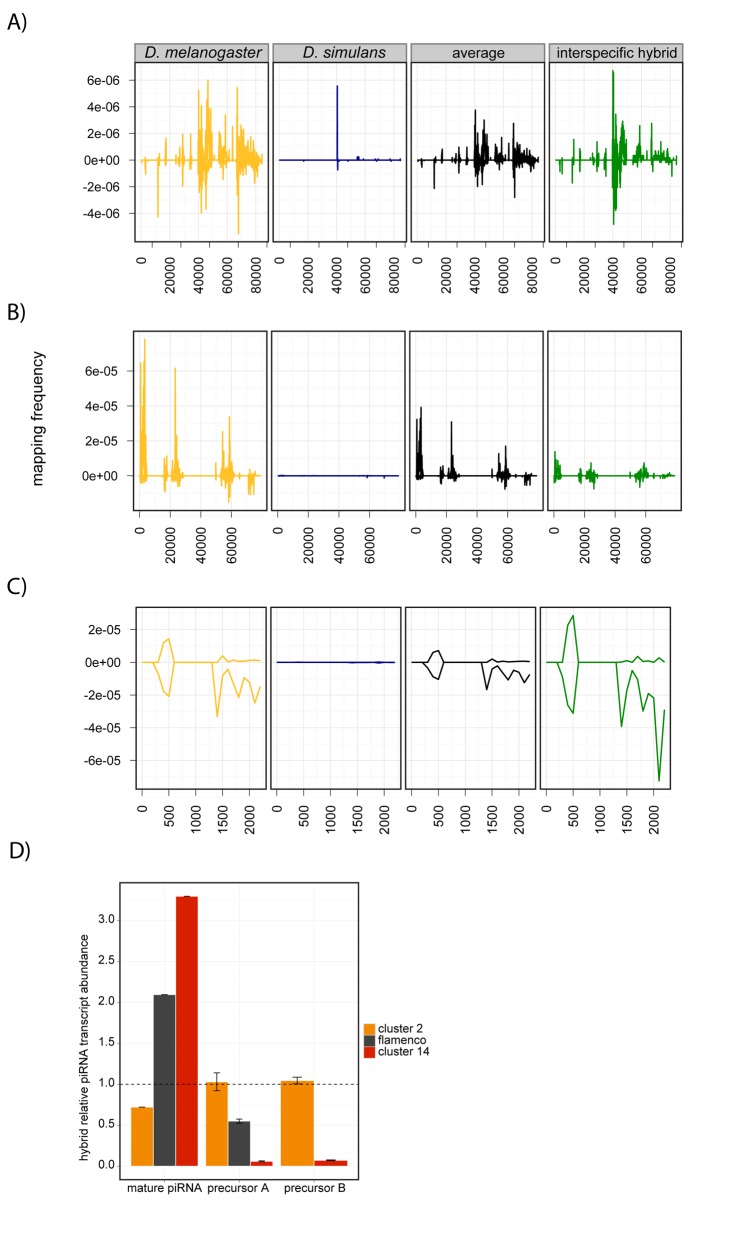
Figure 5. Aberrant activity of piRNA clusters in interspecific hybrids.
(A–C) Frequency of uniquely mapping piRNAs derived from D. melanogaster piRNA clusters 9 (A), 5 (B), and 10 (C) for D. melanogaster (yellow), D. simulans (blue), and interspecific hybrids (green). Average indicates the additive expectation for interspecific hybrids (black). (D) Abundance of precursor transcripts (qRT-PCR) and mature piRNAs (small RNA-seq) from piRNA clusters 2, 14, and flamenco, relative to the interspecific average. Dotted line indicates no change in relative expression. Precursors A and B denote two independently measured locations in the precursor transcript.

