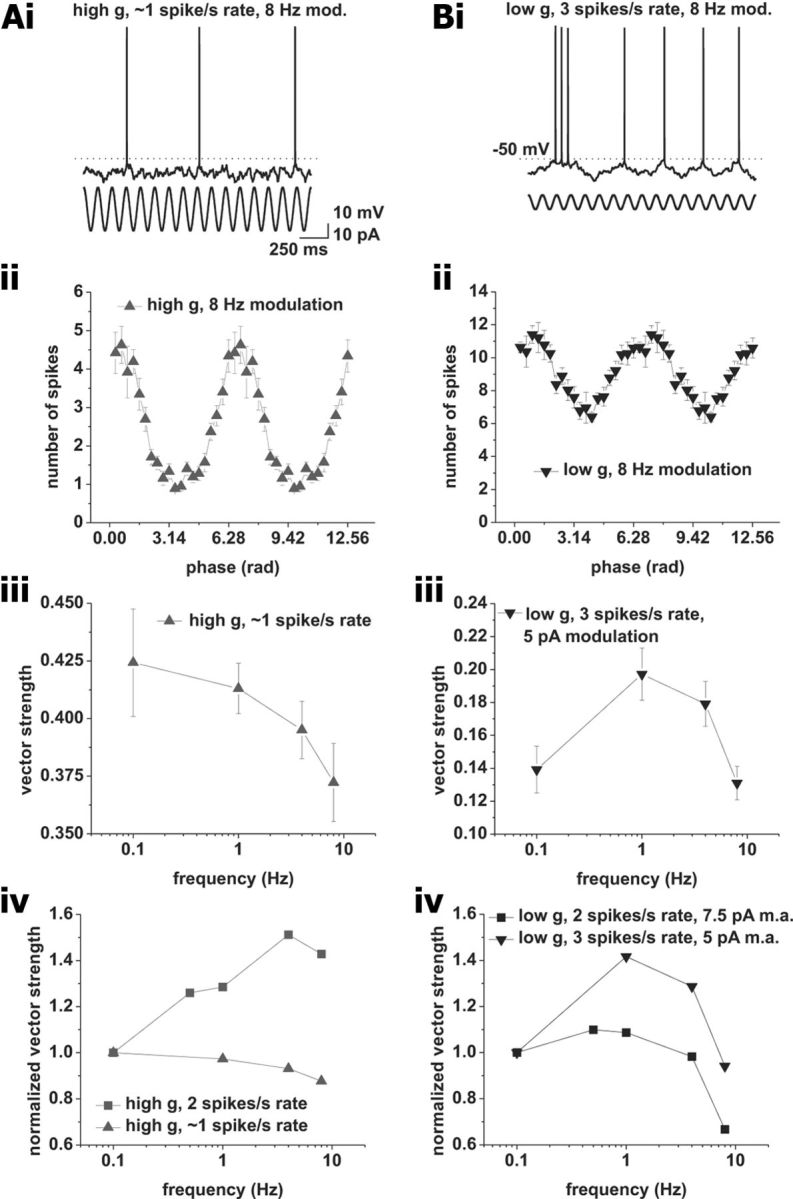
Figure 5.

Action potential phase-locking peaks are sensitive to changes in firing rate. A, Phase locking at average firing rates of 1 spike/s under high conductance with a modulation amplitude of 15 pA. i, Example voltage trace. Sinusoidal modulation at 8 Hz is indicated below the voltage trace. ii, Average spike–phase histogram in response to 8 Hz modulation at an average spike rate of 1 spike/s. iii, Vector strength versus modulation frequency. Tested modulation frequencies were as follows: 0.1, 1, 4, and 8 Hz. iv, Comparison between vector strength at average firing rates of 1 (upward triangles) and 2 (squares) spikes/s. The vector strength normalized to 0.1 Hz modulation is plotted versus the modulation frequency. Note the change from low pass at 1 spike/s average rate to bandpass at 2 spikes/s mean rate. B, Phase locking at average firing rates of 3 spikes/s under low conductance with a modulation amplitude of 5 pA. i, Example voltage trace. Frequency modulation of 8 Hz is indicated by the sinusoid below the voltage trace. ii, Average spike–phase histogram in response to 8 Hz modulation at an average spike rate of 3 spikes/s. iii, Vector strength versus modulation frequency. Tested modulation frequencies were as follows: 0.1, 1, 4, and 8 Hz. iv, Comparison between vector strength at average firing rates of 3 (downward triangles) and 2 (squares) spikes/s. Vector strength normalized to 0.1 Hz modulation is plotted versus the modulation frequency. Modulation amplitude for 2 spikes/s mean rates was 7.5 pA; amplitude for 3 spikes/s mean rate was 5 pA. Note the change from low pass at 2 spikes/s average rate to bandpass at 3 spikes/s mean rate.
