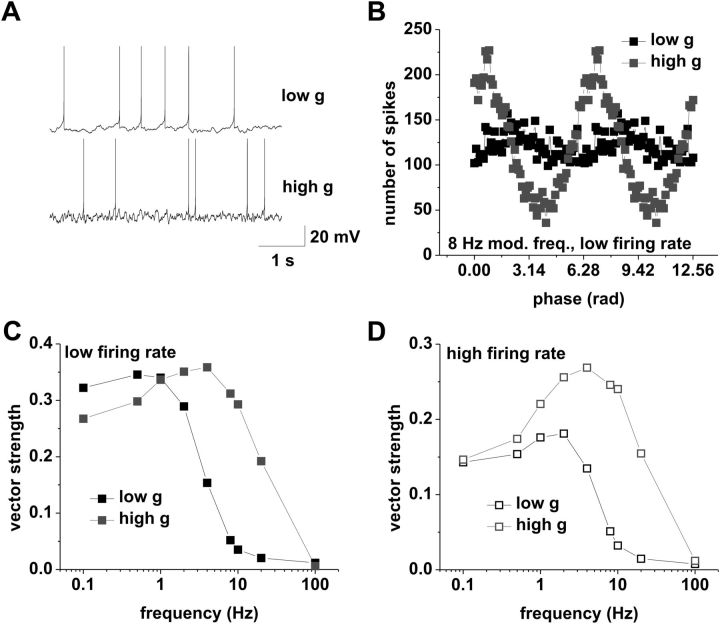
Figure 9.
Phase-locking profiles of CA1 pyramidal neurons can be qualitatively reproduced in a simple model incorporating spike frequency adaptation and a resonant current. A, Example of simulated voltage traces under low (top trace) and high (bottom trace) conductance, at mean rates of 1.5 spikes/s. B, Average spike–phase histogram in response to 8 Hz modulation at average spike rates of 1.5 spikes/s. Low conductance is shown in black; high conductance is shown in gray. C, Vector strength versus modulation frequency at a mean rate of 1.5 spikes/s under low (black) and high (gray) conductance. Model parameters were as follows: low g, gL = 0.03 mS/cm2, IDC = −0.098 μA/cm2, IA = 0.018 μA/cm2, gn = 0.04 μA/cm 2; high g, gL = 0.18 mS/cm2, IDC = 0.43 μA/cm2, IA = 0.098 μA/cm2, gn = 0.2 μA/cm2. Tested modulation frequencies were as follows: 0.1, 0.5, 1, 2, 4, 8, 10, 20, and 100 Hz. D, Vector strength versus modulation frequency at a mean rate of 4 spikes/s under low (black) and high (gray) conductance. Model parameters were as follows: low g, gL = 0.03 mS/cm2, IDC = −0.058 μA/cm2, IA = 0.018 μA/cm2, gn = 0.04 μA/cm2; high g, gL = 0.18 mS/cm2, IDC = 0.68 μA/cm2, IA = 0.098 μA/cm2, gn = 0.2 μA/cm2. Tested modulation frequencies were as follows: 0.1, 0.5, 1, 2, 4, 8, 10, 20, and 100 Hz.

