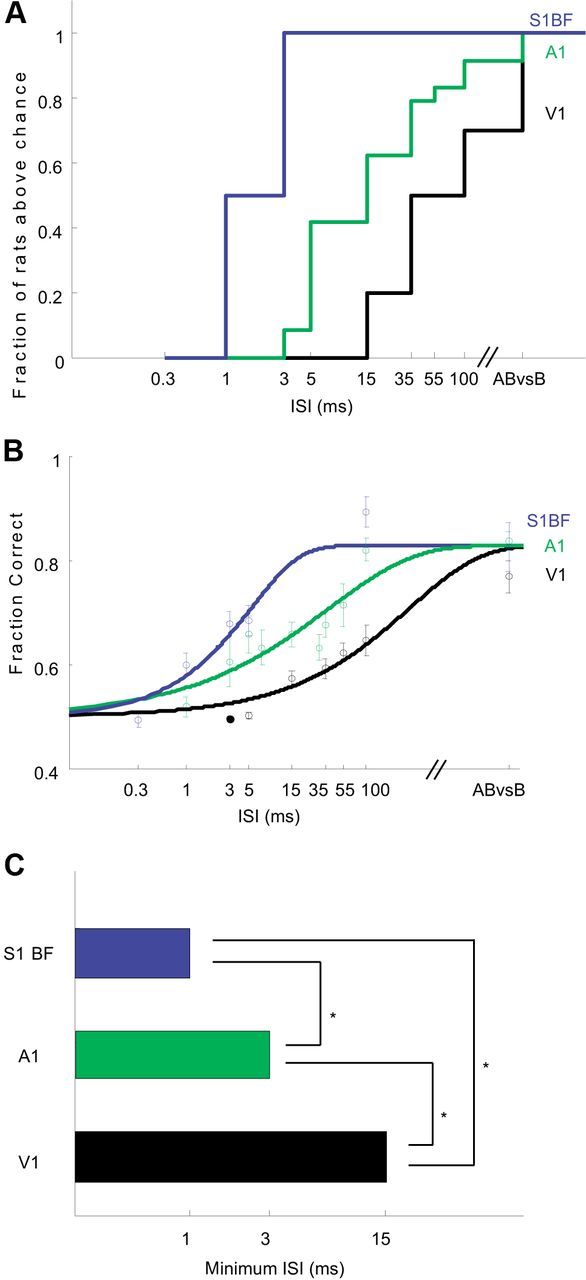
Figure 2.

Different cortical areas differ in their ability to detect fine timing. A, Cumulative histogram showing fraction of animals able to discriminate each ISI for auditory (N = 26), visual (N = 10) and barrel (N = 6) cortex stimulation. The barrel cortex is most sensitive to fine temporal differences, followed by auditory cortex, followed by visual cortex. Auditory data reanalyzed from reference (Yang et al., 2008). B, The mean best performances as a function of ISI for different groups of rats recapitulates the sequence barrel>auditory>visual. Data were fit using cumulative Weibull Function (Wichmann and Hill, 2001; see Materials and Methods). C, Minimum detectable ISI for different cortices. Significance at 5% level by Fisher exact test.
