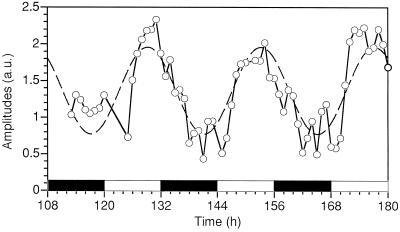
Figure 5.
Average amplitudes of O2 production under flashing light in Cyanothece sp. ATCC 51142 after a photoactivation treatment and over a 3-d period starting 108 h after subculture. Black bars, Dark periods; white bars, light periods. The dashed line represents a sine wave with a fixed 24-h period, which had the phase and amplitude fitted to the data using the DeltaGraph program (Delta Point, Inc., Monterey, CA). a.u., Arbitrary units.

