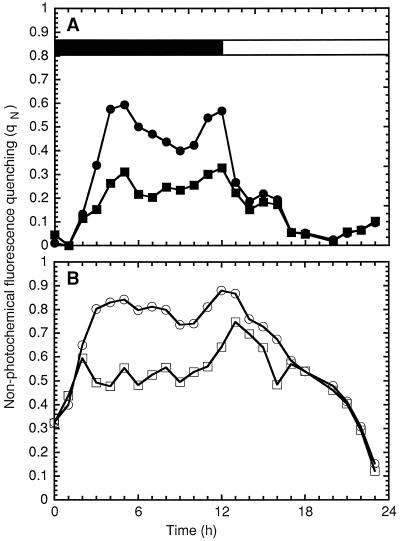
Figure 7.
Calculations of qN in 1 mL of Cyanothece sp. ATCC 51142 grown under 12-h light/12-h dark conditions using the levels of fluorescence depicted in Figure 6. Black bar, dark period; white bar, light period. A, Remaining qN after the induction of state 1 measured with flashes (▪) or with the actinic light (•). B, Total qN in the dark in the presence of DCMU measured with flashes (□) or with the actinic light (○).

