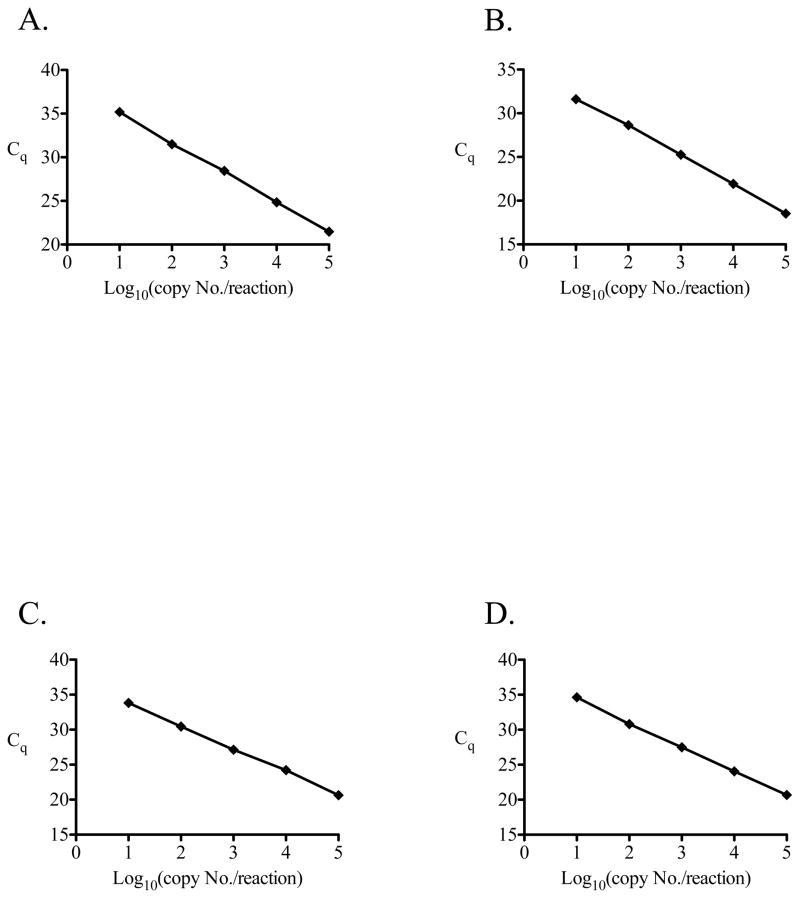
Figure 1.
Representative graphs displaying calibration curves that were used for validation of EEHV qPCR assays: EEHV2 (A), EEHV3/4 (B), EEHV5 (C), and EEHV6 (D). Calibrations curves are shown over a target concentration range of 10 to 100,000 target copies per reaction and assay parameters are shown in Table 1.

