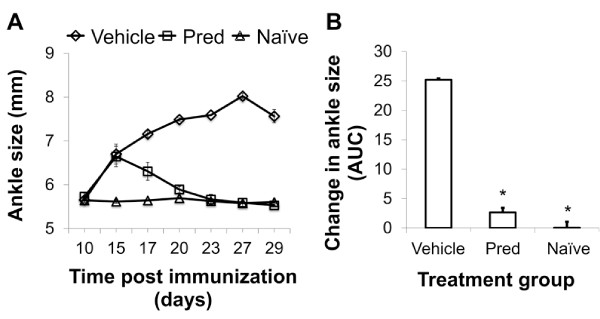
Figure 6 .
Clinical measurements of ankle size.A. Ankle swelling in 3 cohorts, naïve (Δ), diseased treated (□) and diseased vehicle control (◇) are plotted over time. B. Change in ankles size expressed as area under the curve (AUC). * P < 0.0001 as compared to vehicle control using Dunnett’s method.

