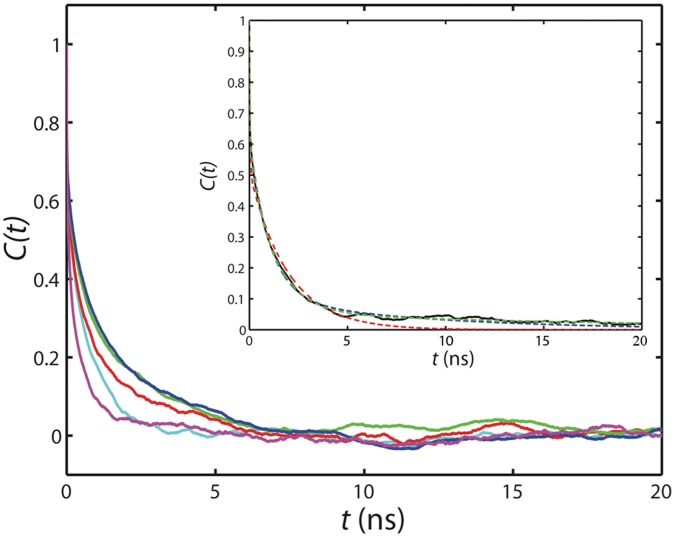
Figure 6. Correlation functions of selected backbone 1H-15N amide bond vectors (red: residue 2; green: residue 10; blue: residue 48; magenta: residue 57; cyan: residue 102) extracted from a 400 ns MD trajectory of ProTα.
The inset shows the fitting of the autocorrelation function (solid black line) of residue 31 to 2- (red dash line), 3- (blue dash line), and 4-exponential decay curves (green dash line) as indicated in Equation 2. The blue and green dash lines overlay remarkably, and only start to deviate when t >15 ns.

