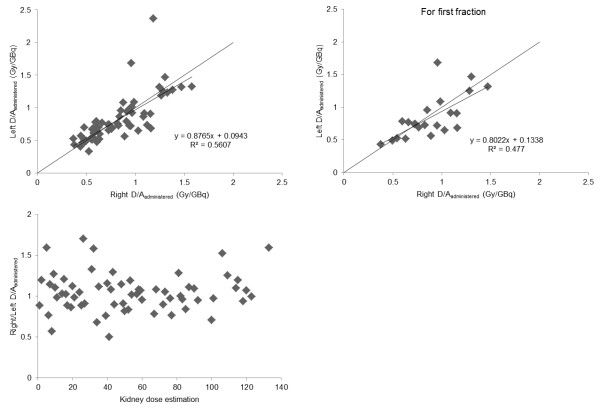
Figure 4.
Comparison between the mean absorbed dose per unit administered activity to the left and right kidneys. Comparison between the mean absorbed dose per unit administered activity to the left and right kidneys for (A) all treatment cycles and (B) only the first treatment cycle. (C) Ratio between the absorbed dose to the right and left kidneys for all treatment cycles in the studied 22 patients.

