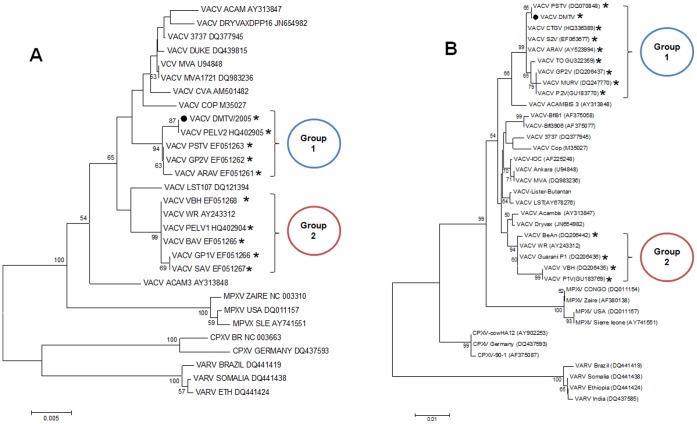
Figure 4. Phylogenetic trees generated from OPV nucleotide sequences, including the Brazilian VACV strains.
Phylogenetic analyses of B5R (A) and A56R (B) sequences showed that the Brazilian VACV strains are split into two different branches (Groups 1 and 2), which do not cluster directly with the vaccine strains (vaccine strains: those with no asterisk; and VACV-WR, a laboratorial strain). The DMTV-2005 isolate is depicted as a black dot. The Brazilian VACV strains are depicted with asterisks. Maximum likehood trees were reconstructed using different datasets containing sequences from the genes listed above, using MEGA 4.0. Using ModelTest, server [35] the nucleotide substitution model of Tamura 1992 was selected as the best one fitting the data. Rates of variation among sites were estimated for each dataset and two discrete Gamma categories were used to model evolutionary rate differences among sites and the reliability of branching patterns was tested through 1000 bootstrap sampling.

