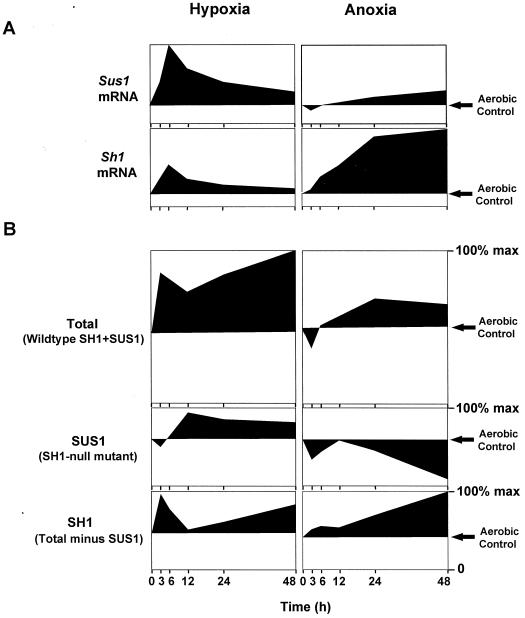
Figure 6.
Dissection of contributions from Sus1 and Sh1 at the mRNA (A) and enzyme activity levels (B) under hypoxia (3% O2) and anoxia (0% O2) relative to aerobic controls (21% O2). Profiles at the mRNA level represent data from the isogenic W22 inbred line (derived from Figs. 1B and 2B) and are pictured for comparative purposes. Profiles at the enzyme activity level represent data from total Suc synthase (SH1 plus SUS1) in the wild-type W22 inbred line (derived from Fig. 3B), data from SUS1 alone in an isogenic sh1-null mutant (derived from Fig. 4B), and SH1-dependent activity (determined from comparison of SUS1 activity to total Suc synthase activity in the isogenic wild type). That Sus1 mRNA and SUS1 protein level responded similarly in wild-type or mutant material is indicated in Figures 1A, 3C, and 4B. Profiles are expressed as a percentage of the maximum activities for SUS1 and SH1 together, SUS1 alone, or SH1-dependent activity, which were 152, 77, and 75 μmol Suc g−1 fresh weight h−1, respectively. Decreases in activity relative to aerobic controls are shown as profiles extending below this aerobic reference line in each figure.

