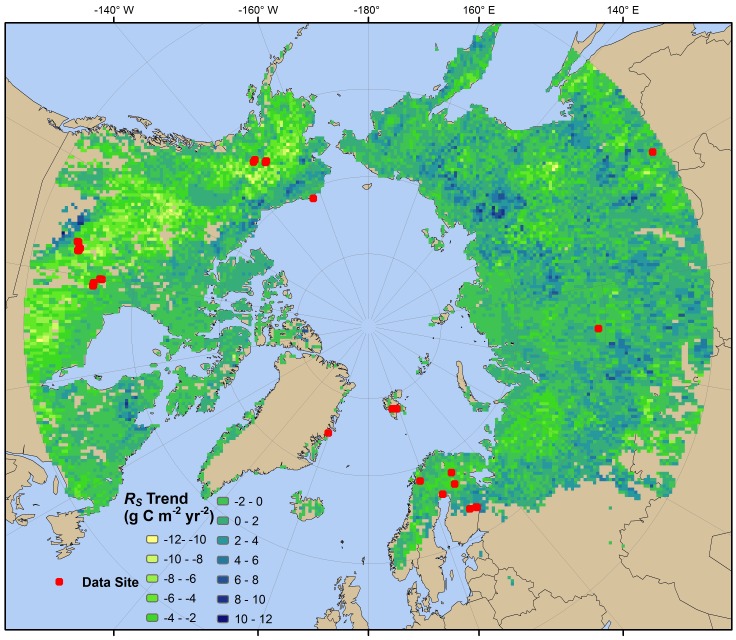
Figure 2. Spatial distribution of 1989–2008 soil respiration trends (R S, g C m−2 yr−2).
Grid cells are colored by slope of R S trend, computed based on the best fitting model (conditional-inference Random Forest, using monthly NDVI data up to 5 years previously) from Table 1. Field studies used in building the models, drawn from a global R S database [27], are shown by overlaid points.

