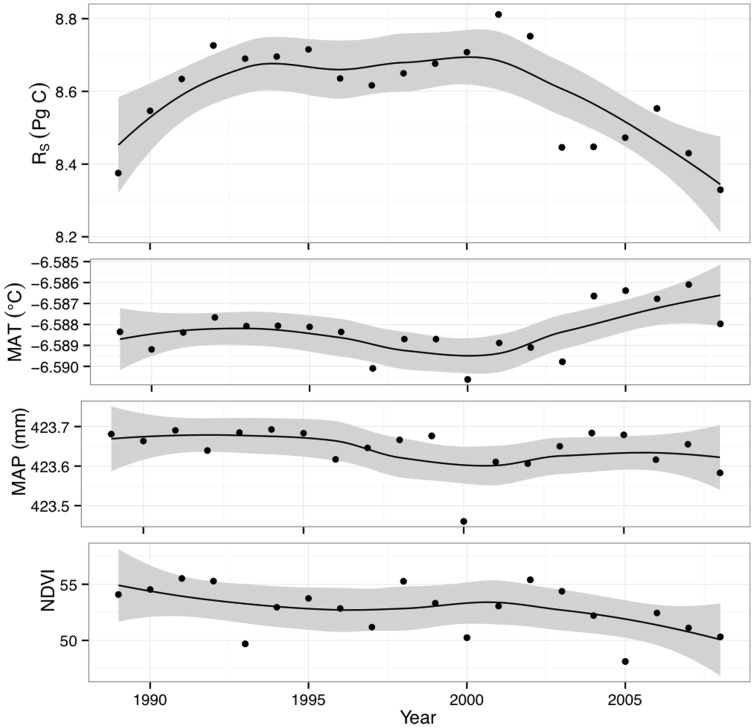
Figure 3. Predicted high-latitude soil respiration (R S), by year, with main driver variables.
Panels show, from top, R S predicted flux; mean annual temperature (MAT); mean annual precipitation (MAP); and previous-June canopy greenness (NDVI, unitless). R S points show integrated result of the best-performing Random Forest model; to highlight trend, a loess smoother is shown by the dark line. Smoother errors (gray regions) were computed as the least-squares error on locally weighted scatterplot smoothing.

