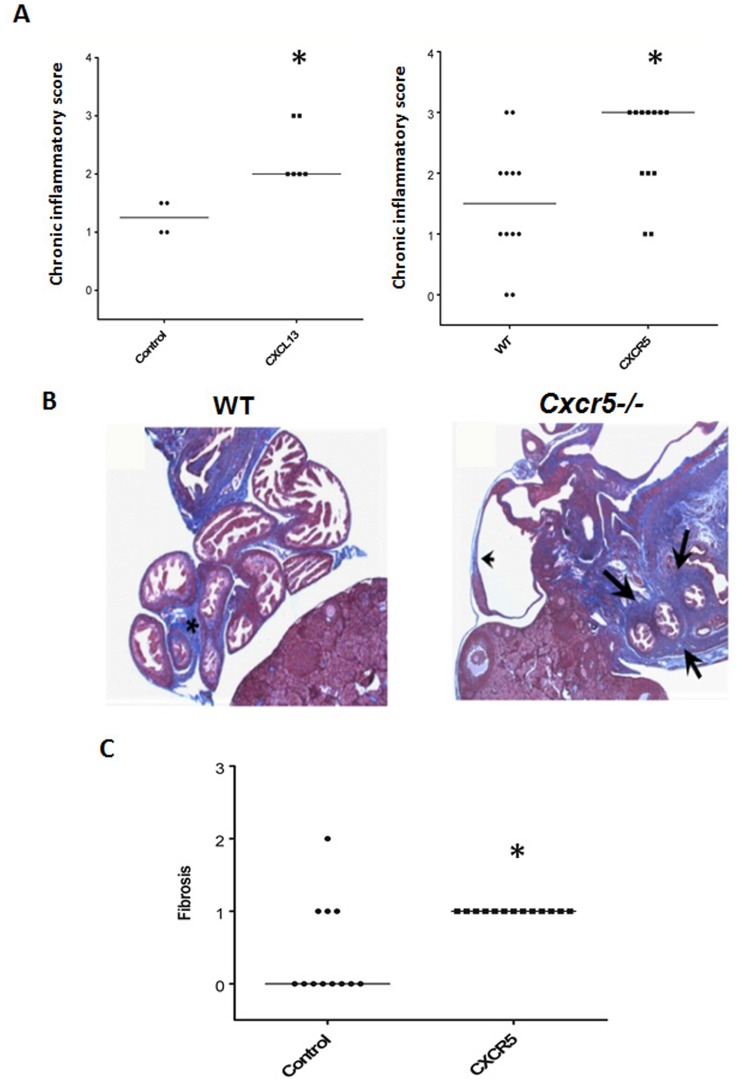
Figure 2. Disruption of the CXCL13-CXCR5 axis increased UGT pathology.
GTs were harvested 49 days after infection and processed en bloc for paraffin sections. (A) Scatter plot and median of chronic inflammatory scores of BALB/c mice treated with anti-CXCL13 Ab versus an irrelevant control Ab or C56BL/6 WT mice versus Cxcr5−/− mice from hematoxylin and eosin stained slides. *p<0.05, Mann-Whitney, n = 3–6 mice or 12 oviducts/group. (B) Photomicrograph of trichrome stained sections from oviducts 49 days after infection of C57BL/6 (WT) or Cxcr5−/− mice. Asterisk (WT) and arrows (Cxcr5−/−) show fibrosis and arrowhead (Cxcr5−/−) depicts a dilated oviduct. Sections are at 20×. (C) Fibrosis scores of C56BL/6 WT mice and Cxcr5−/− mice from trichrome stained slides. *p<0.01, Mann-Whitney, n = 6 mice or 12 oviducts/group.

