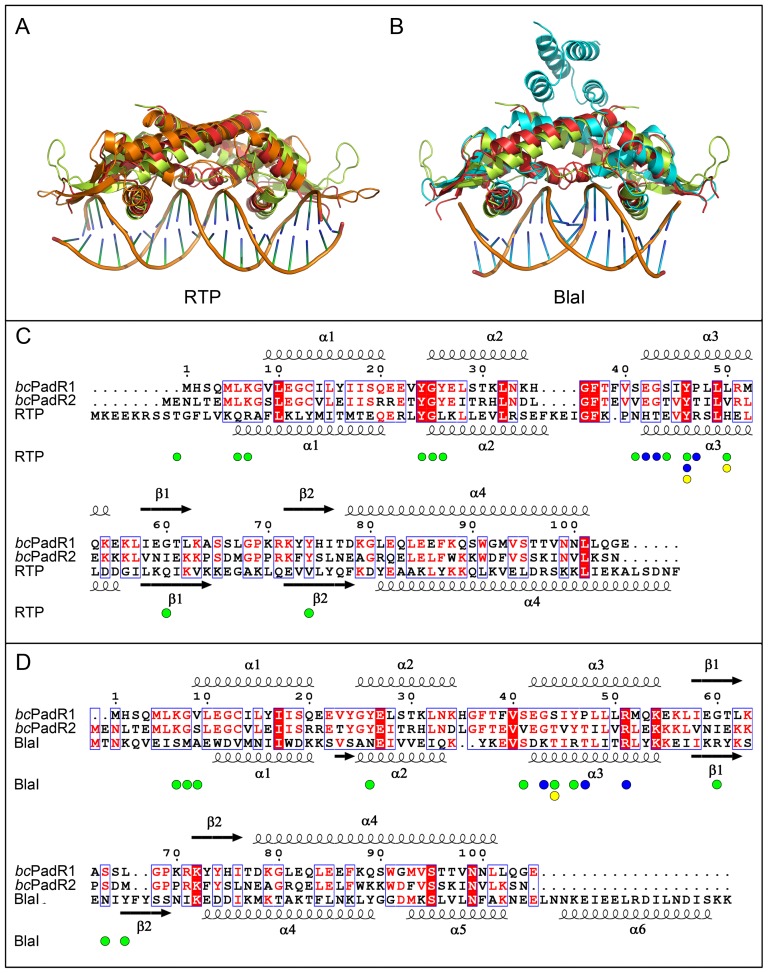
Figure 5. Modeling of the DNA-bound bcPadR complexes.
(A) Superposition of the bcPadR1 (light-green) and bcPadR2 (red) dimers onto DNA-bound RTP (orange, PDB code 1F4K). (B) Superposition of the bcPadR1 (light-green) and bcPadR2 (red) dimers onto DNA-bound BlaI (cyan, PDB code 1XSD). Below the superpositions are structure-based sequence alignments including secondary structures. Residues of RTP and BlaI which participate in DNA binding are indicated with small spheres using the following color scheme: green, interacting with the phosphate backbone; blue, interacting with the base moiety and yellow, interacting with the ribose backbone).

