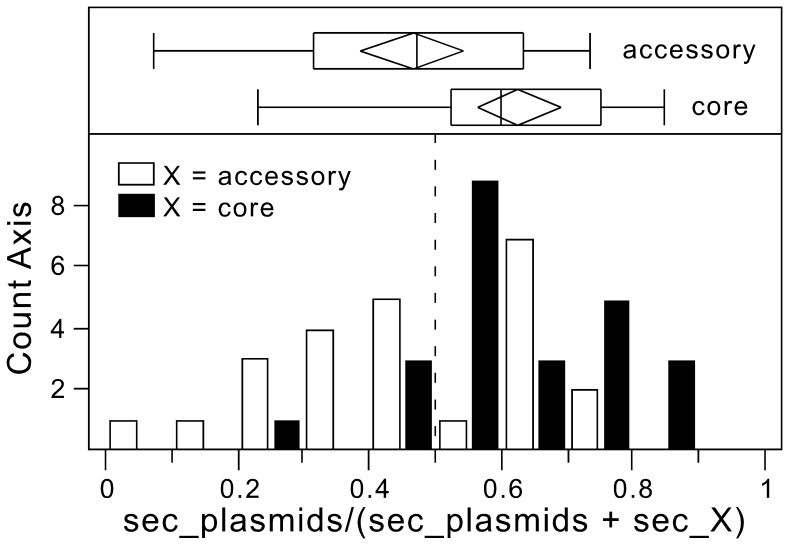
Figure 3. Comparison of the fraction of genes encoding the secretome in plasmids relative to the fraction of genes encoding the secretome in the core and in the accessory genomes.
Lower panel. We only analyzed clade encoding more than 50 plasmid genes with predicted protein cell localization. For each clade, we computed the fraction of the secretome (extracellular, cell wall, outer membrane) encoded in plasmids (secplasmids) and divided this by the sum of the fraction encoded in the plasmids and the core (black, seccore) or the accessory genome (white, secaccessory). The precise formulae are secplasmids/(seccore+ secplasmids) and secplasmids/(secaccessory+ secplasmids). If there are no significant differences between sets then the value should be close to 0.5. Values higher that 0.5 indicate over-representation among plasmids relative to the other set. The graph represents the two histograms. Upper panel. Boxplots of the two distributions represented in the lower panel. Edges of boxplots are the extremes of the distribution, the box represents the 25% and 75% quantiles, the inner line represents the median. Diamonds represent the mean and its 95% interval of confidence.

