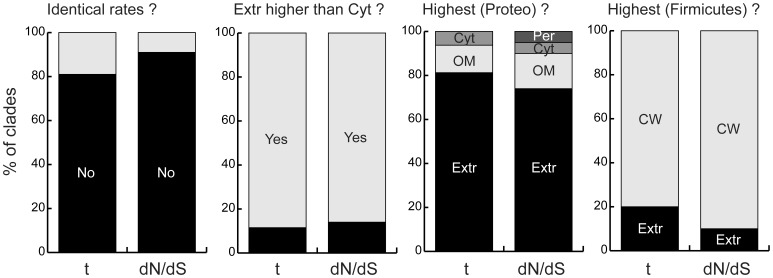
Figure 4. Analysis of substitution rates of genes encoding proteins with different cell localizations.
The four graphs correspond to the results of the following analyses (from left to right). (i) The 32 tests, one per clade, that substitution rates are the same for genes encoding proteins with different cell localizations (Wilcoxon test, p<0.05). For the cases where the previous hypothesis was rejected we depict: (ii) the fraction of clades where the average rates in genes encoding extracellular proteins exceed those of genes encoding cytoplasmic proteins, (iii) the protein localization whose genes have highest average values for Proteobacteria and (iv) the same for Firmicutes. In all bars the deviation of the distribution from random is highly significant (p<0.01, binomial or multinomial tests). Localizations are abbreviated as in Figure 1. The labels “t” and “dN/dS” represent the substitution rate per codon and the ratio of non-synonymous over synonymous substitutions.

