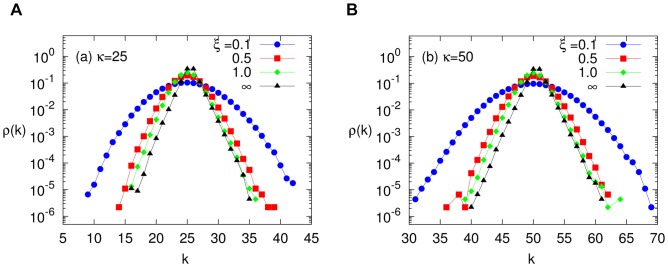
Figure 1. Degree distribution of preferred degree networks.
Networks with  nodes and various inflexibility parameters
  (see Eq. 1). Panels (a) and (b) corresponds to
  and
and  respectively. The
  corresponds to the totally inflexible individuals and results in a Laplace distribution.

