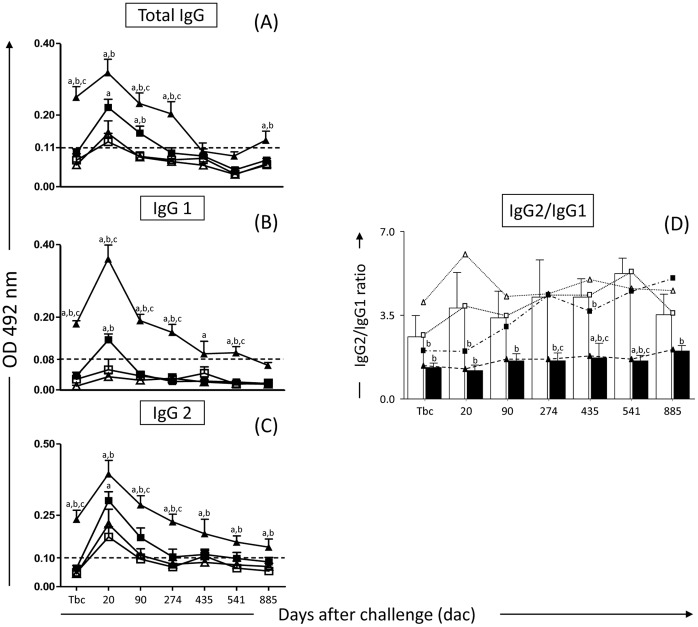
Figure 1. Anti-Leishmania reactivity in serum from dogs submitted to different vaccination protocols before and after intradermal challenge with L. infantum plus SGE: C (control; white square); Sap (saponin; white triangle); LB (killed L. braziliensis vaccine; black square); LBSap (killed L. braziliensis vaccine plus saponin; black triangle).
IgG2/IgG1 ratio: C (control; white square) and LBSap (killed L. braziliensis vaccine plus saponin; black square). Figure 1A represents anti-L. infantum total IgG, (B) anti-L. infantum IgG1, (C) anti-L. infantum IgG2 and (D) IgG2/IgG1 ratio: the x-axis displays the times at which the assays were conducted (Tbc: time before challenge with L. infantum; and 20, 90 274, 435, 541 and 885 days after challenge [dac] with L. infantum), and the y-axis represents the mean ELISA absorbance values determined at 492 nm in serum samples diluted 1∶80 for IgG total and subclasses. The cut-off is represented by the dotted line. Significant differences (p<0.05) between the LBSap group and the control C, Sap and LB groups are indicated, respectively, by the letters a, b, and c.

