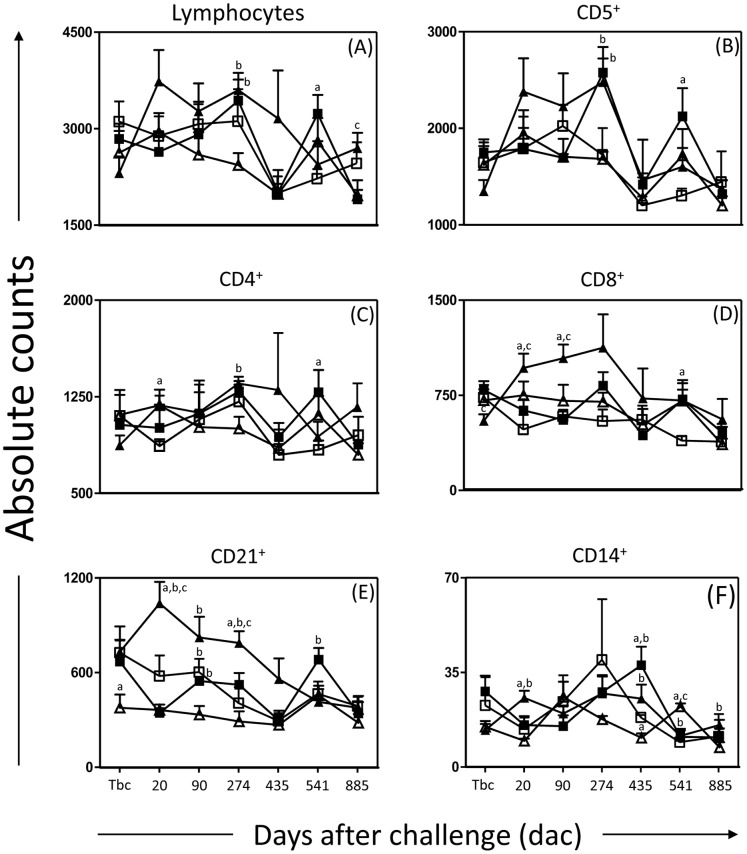
Figure 2. Cellular profile of circulating lymphocytes and monocytes in dogs submitted to different vaccination protocols before and after challenge with L. infantum plus SGE.
C (control; white square); Sap (saponin; white triagle); LB (killed L. braziliensis vaccine; black square), LBSap (killed L. braziliensis vaccine plus saponin; black triagnle): the x-axis displays the times at which the assays were conducted (Tbc: time before challenge with L. infantum; and 20, 90 274, 435, 541 and 885 days after challenge [dac] with L. infantum), and the y-axis represents the mean values of the (A) absolute counts of circulating lymphocytes and of (B) CD5+, (C) CD4+, (D) CD8+, (E) CD21+ cells and (F) CD14+ monocytes. Significant differences (p<0.05) between the LBSap group and the control C, Sap and LB groups are indicated, respectively, by the letters a, b and c.

