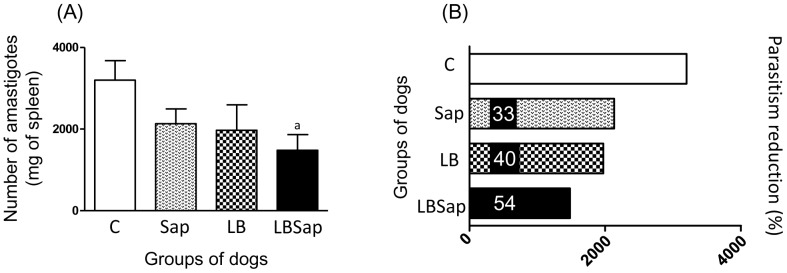
Figure 5. Quantification of parasite burden in spleen samples at 885 dac (days after challenge with L. infantum plus SGE) for vaccinated groups: C (control; white); Sap (saponin; white with weak hatched); LB (killed L. braziliensis vaccine; white with strong hatched); LBSap (killed L. braziliensis vaccine plus saponin; black).
(A) The quantification of amastigote forms of Leishmania/mg of spleen using real time PCR with specific primers for a single-copy gene of DNA polymerase of Leishmania infantum. (B) Parasitism reduction (%) in Sap, LB and LBSap in comparison with the control C group. Results were plotted representing median values for each group. Significant differences (p<0.05) between the LBSap and the control C group are represented by the letter a.

