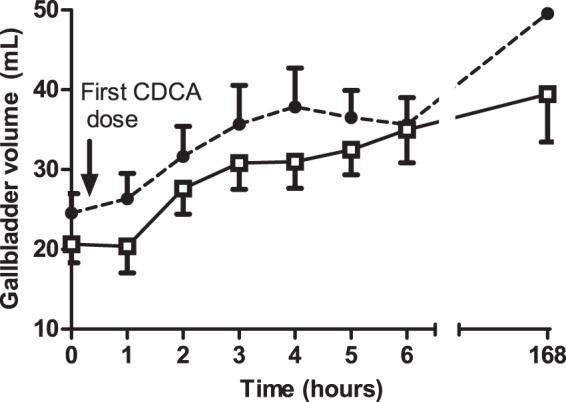
Figure 3. Gallbladder volume as a function of time after ingestion of chenodeoxycholic acid in patients with Crohn's colitis and disease controls.

Gallbladder volumes progressively rise in all patients (p = 0.00) without differences between both groups  Crohn's patients;
  Disease controls.
