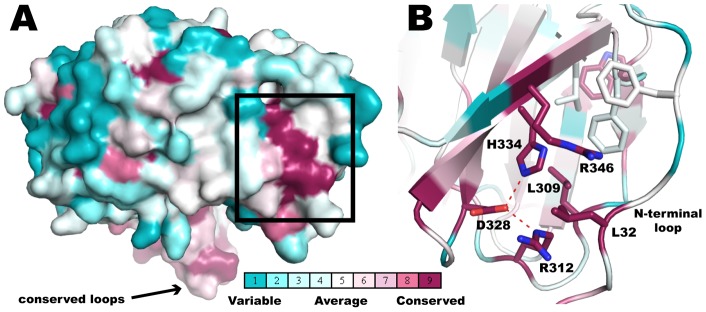
Figure 6. BamB Surface Residue Conservation Analysis.
335 BamB sequences were subjected to Consurf analysis to create conservations scores (see text for details). The conservation is color coded as follows: conservation scores are segregated into 9 discrete bins, such that bin 1 contains the most rapidly evolving residues (most variable) and is colored blue; bin 5 contains residues with average rate of evolution (colored white); and bin 9 has the most conserved residues and is colored dark purple. (A) Side view of a surface representation of BamB displaying a patch of conserved residues on the side of the propeller. (D) Close up of the region framed in (C) detailing the interactions at the groove between blades 6 and 7 and the N-terminal loop.

