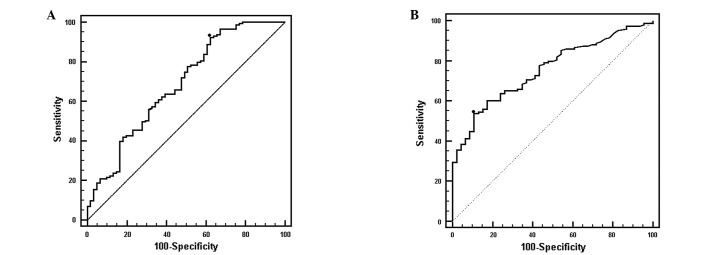
Figure 2.
ROC curves: HCC presence. ROC curves demonstrate the potential of sCD25 as a predictor of HCC presence. (A) At a cut-off value of 2,180 pg/ml the sensitivity of sCD25 for HCC presence was 92.3% and the specificity was 37.7% (AUC=0.685). (B) Sensitivity of AFP was lower than the sensitivity for sCD25. At a cut-off value of 39.7 ng/ml, the sensitivity of AFP was 53.1% while its specificity was 89.1% (AUC=0.753). ROC, receiver operator characteristic; sCD25, soluble CD25; HCC, hepatocellular carcinoma; AUC, area under the ROC curve; AFP, α-fetoprotein.

