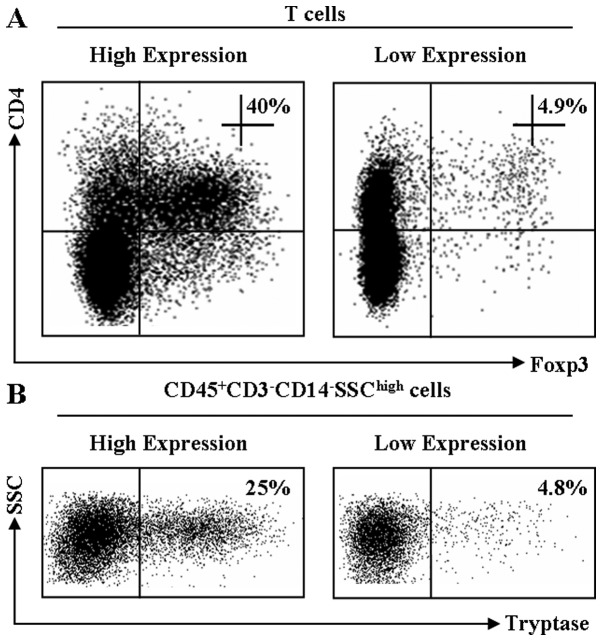
Figure 1.
Numbers of Tregs and MCs are increased in tumor tissues. Single-cell suspensions of normal (right) and tumor (left) tissues were prepared from fresh human GC stained with relevant antibodies. Tregs and MCs were analyzed by flow cytometry. The specimens were from 60 patients with GC (see Table I and Materials and methods). The results of one patient are shown. (A) Tregs (Foxp3) in T cells (gated CD4 cells) from the tumor were analyzed by flow cytometry. Numbers on the plots are the proportions of Foxp3+ cells in the CD4+ cells. (B) MCs in CD45+CD3−CD14−SSChigh cells. Numbers on the plots are the proportions of tryptase+ cells in the CD45+CD3−CD14−SSChigh cells. MC, mast cell; Treg, regulatory T cell; GC, gastric cancer.

