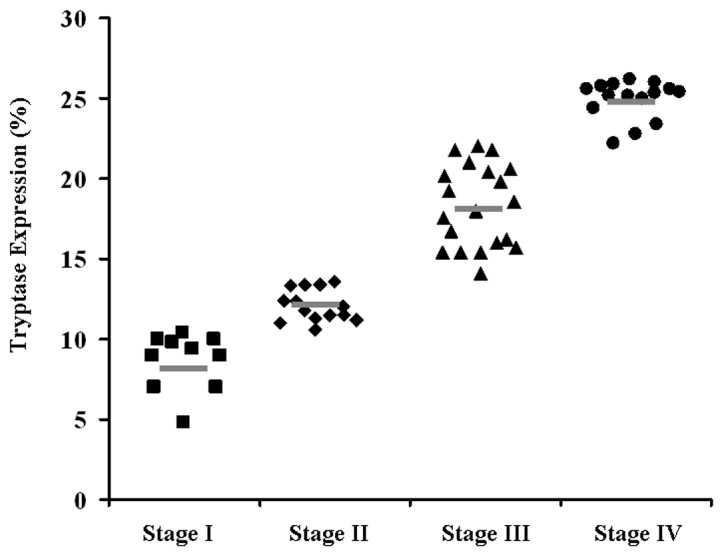
Figure 3.

Correlation between number of MCs and stage of GC in the total set of subjects. The percentages of tryptase expression are separated into four groups by the TNM stage. The short bar indicates the mean value in each group. MC, mast cell; GC, gastric cancer.
