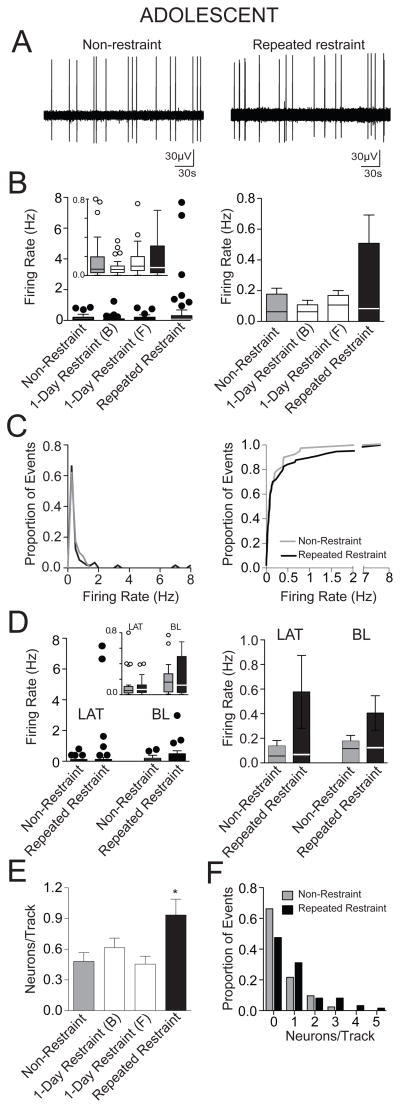
Figure 4. Repeated restraint stress increased the number of spontaneously active BLA neurons in adolescent rats.
(A) A recording trace of a BLA neuron recorded from a non-restraint rat (left) and a repeated restraint rat (right). (B) There was no significant difference in the firing rate between non-restraint and repeated restraint rats. Single restraint did not significantly impact firing rate. A box and whisker plot displays the median and 1.5 × IQR (left), with an inset of the same plot at a different scale (y-axis is cut-off at 0.8 Hz to facilitate comparison of the distribution and median in this inset). The overall mean (bar) and medians (line through bar) are displayed to facilitate comparison (right). (C) The distribution of the firing rates (left) demonstrates that there is a very similar distribution between non-restraint and repeated restraint groups. Cumulative frequency histograms display similar distribution of firing rates between the non-restraint group and repeated restraint group (right). (D) There was no significant effect of repeated restraint on the firing rate of neurons from the LAT or the BL. Box and whisker plots (left) display the median and 1.5 × IQR, the inset displays the same data at a different scale (y-axis cut at 0.8 Hz). The mean (bar) and medians (line through bar) are displayed for comparison (right). (E) Repeated restraint rats displayed significantly higher number of spontaneously firing neurons encountered per electrode track compared to non-restraint rats, indicative of increased relative number of active neurons after repeated restraint. Single restraint did not significantly impact number of spontaneously firing neurons encountered per electrode track. (F) Frequency distribution histograms of the number of spontaneously firing neurons per electrode track demonstrated different distribution between the non-restraint and repeated restraint groups. * indicates p<0.05 versus non-restraint group.

