
Figure 1.
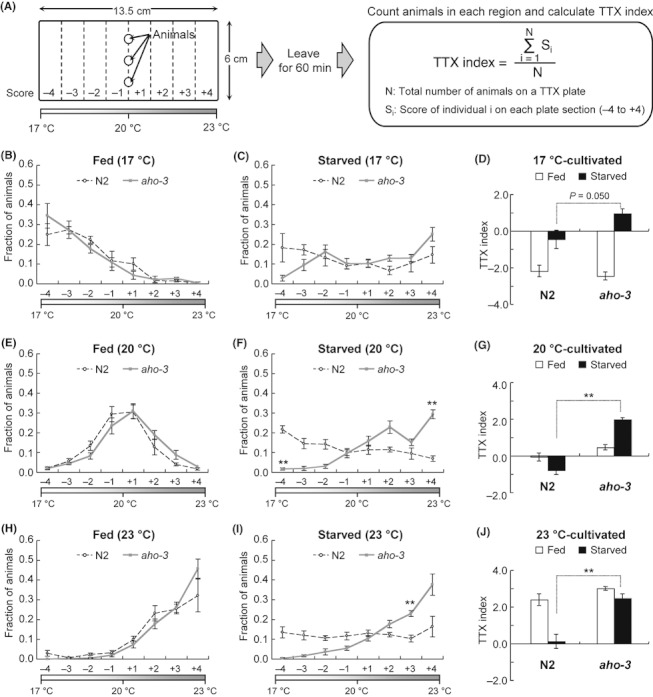
aho-3 mutants show abnormalities in thermotactic plasticity. (A) Procedures for population thermotaxis assay using a linear thermal gradient (Ito et al. 2006); 40–300 animals cultivated at 17, 20 or 23 °C were placed on the centerline of a TTX (thermotaxis) plate and allowed to move freely for 60 min. The animals in each region (from −4 to +4) were counted, and the TTX index was calculated as described. A 17–23 °C thermal gradient was always used in this study, except for Figure S1 in Supporting Information (see Experimental procedures for detail). (B–J) Thermotaxis of well-fed or starved wild-type N2 animals and aho-3(nj15) mutants that were cultivated at 17 °C (B–D), 20 °C (E–G) or 23 °C (H–J). n ≥ 4 assays. Error bars represent SEM. In (B, C, E, F and H, I), statistical significance of values in each region was tested by unpaired t-test with the Dunn–Sidak correction for multiple comparisons; *P < 0.05; **P < 0.01. In (D, G and J), statistical significance of TTX indices was tested by unpaired t-test in comparisons of well-fed N2 animals vs well-fed aho-3 mutants or starved N2 animals vs starved aho-3 mutants; *P < 0.05; **P < 0.01.