
Figure 4.
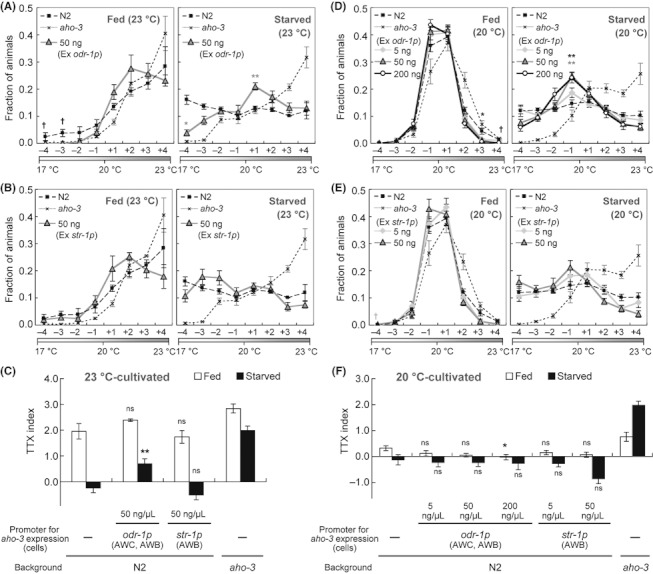
Thermotactic plasticity of animals over-expressing AHO-3. (A–F) Thermotaxis of wild-type animals, transgenic animals and aho-3(nj15) mutants cultivated at 23 °C (A–C) or at 20 °C (D–F) with or without food. The transgenic animals expressing excess AHO-3 in AWC and AWB under the odr-1 promoter (A, D) or only in AWB under the str-1 promoter (B, E) were used. n ≥ 3 assays. Error bars represent SEM. In (A, B and D, E), asterisks represent the comparison of values in individual eight regions by unpaired t-test with the Dunn–Sidak correction for multiple comparison; *P < 0.05; **P < 0.01; colors of asterisks, gray and black, represent the comparisons of N2 animals to each transgenic animals with 50 ng/μL or 200 ng/μL of aho-3cDNA, respectively. Only when all ‘fraction’ values in one dataset were ‘0.00,’ statistical analysis was not performed; in this case, we show a cross with colors, gray and black, representing transgenic animals with 5 ng/μL or 50 ng/μL, respectively. In (C, F), asterisks represent the comparison of transgenic animals with N2 animals by Dunnett test; *P < 0.05; **P < 0.01; ns, not significant (P > 0.05).