
Figure 7.
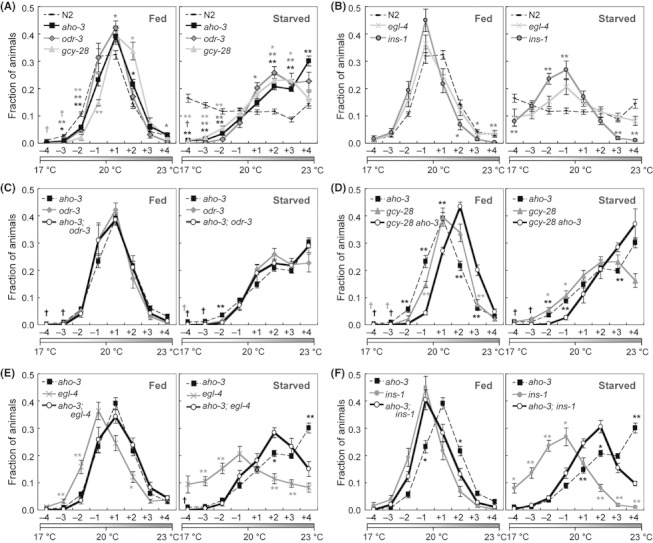
Genetic relationship analysis of aho-3 with genes whose defects cause abnormal thermotactic plasticity. (A, B) Thermotaxis of wild-type N2 and single-mutant animals cultivated at 20 °C with or without food. Phenotypes of aho-3(nj15), odr-3(n1605) and gcy-28(tm2411) are shown in (A), and those of egl-4(n479) and ins-1(nr2091) are shown in (B). (C–F) Thermotaxis of double and single mutants cultivated at 20 °C with or without food. Results of single mutants repeated from (A, B). In all graphs, asterisks represent the comparison of values in individual eight regions by unpaired t-test with the Dunn–Sidak correction for multiple comparisons; *P < 0.05; **P < 0.01; N2 animals vs (A, B) or double mutants vs (C–F) each single mutant. Only when all ‘fraction’ values in one dataset were ‘0.00,’ statistical analysis was not performed; in this case, we show a cross with colors, gray and black, representing single mutants and double mutants, respectively. n ≥ 3 assays. Error bars represent SEM.