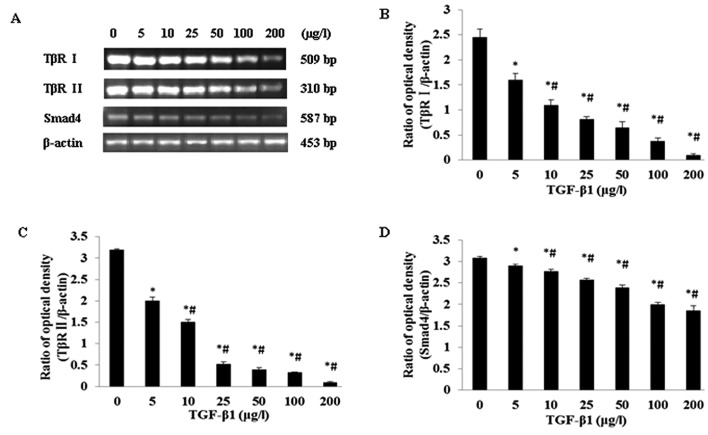
Figure 2.
Regulatory effects of different doses of TGF-β1 on TβR I, TβR II and Smad4 mRNA expression levels in JEG-3 cells. (A) RT-PCR analysis of TβR I, TβR II and Smad4 mRNA levels in JEG-3 cells cultured in different concentrations of TGF-β1; (B,C,D) Statistical analyses. *P<0.05 when compared with TGF-β1 0 μg/l; #P<0.05 when compared with any other group except 0 μg/l.

