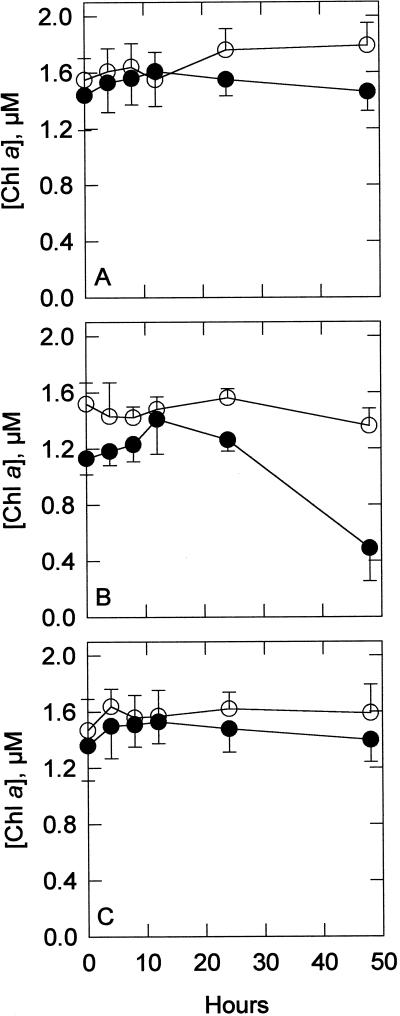
Figure 3.
Spectrophotometric measurements of acetone-extractable chlorophyll (Chl) a. Chlorophyll was extracted into 100% acetone. Extractable chlorophyll concentrations are shown for wild type (○) and sodB− (•) over 48-h treatment periods for control (A), 0.5 μm MV-treated (B), and 5 μm NF-treated (C) groups. Each point is the mean of five or six samples. Error bars are sds.

