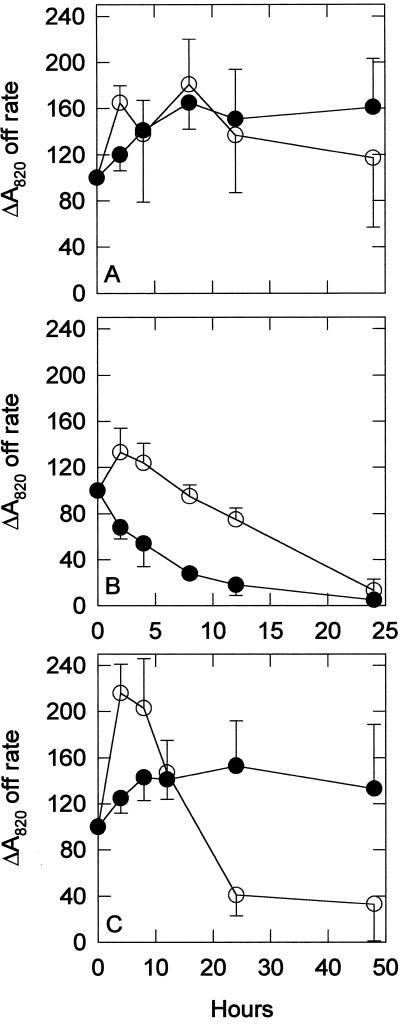
Figure 8.
P700 re-reduction rate with DCMU. The ΔA820 over the initial 50 to 300 ms after the removal of actinic light was used to calculate the initial rate of P700 re-reduction in control (A), 0.5 μm MV-treated (B), and 5 μm NF-treated (C) cultures. ○, Wild-type strain; •, sodB− strain. Each point represents the mean of three to eight samples and all data are percent of initial values. Error bars are sds. The addition of 25 μm DCMU blocks input from PSII. The data shown represent cyclic electron transport.

