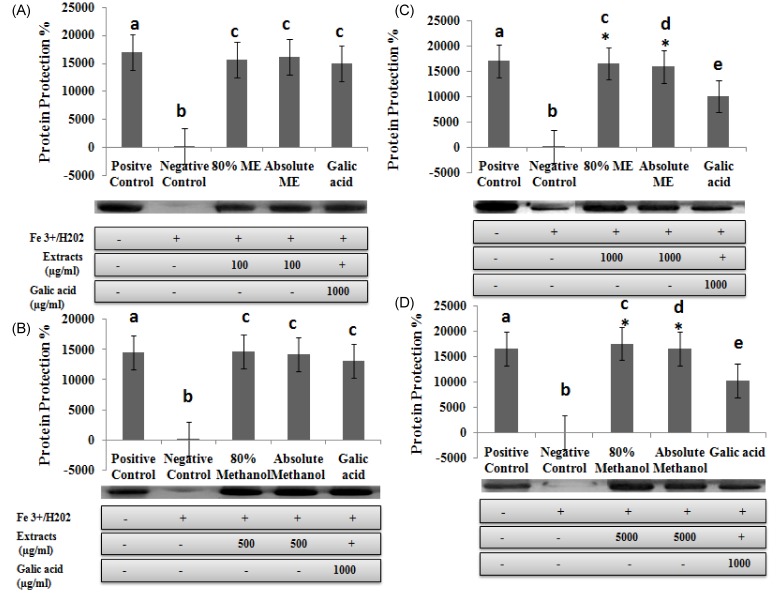
Fig. 5.
Protection of BSA oxidative damage by absolute and 80% methanolic extracts of Rumex crispus. The electrophoretic pattern of BSA and densitometric analysis of the corresponding band intensity has been depicted in all the graphs representing different concentration of the extracted samples i.e. A (100 µg/mL), B (500 µg/mL), C (1,000 µg/mL) and D (5,000 µg/mL). BSA was oxidised by Fenton system (Fe3+/H2O2/ascorbic acid). Each bar represents the mean ± SD of three different experiments. Means with different letters at a time differ significantly, P < 0.05. The values sharing common letters are not significantly different at P < 0.05. *P < 0.05 compared with Fe3+/H2O2/ascorbic acid treated group.

