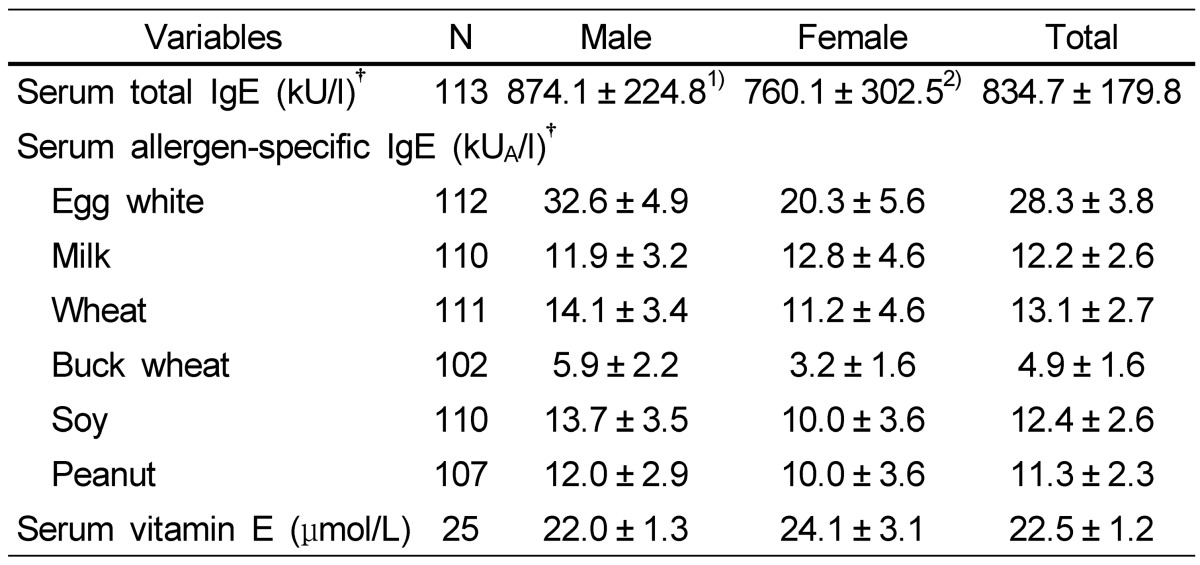
Table 2.
The concentrations of serum vitamin E and serum IgEs
1)Mean ± SE.
2)No significant differences between male and female groups by Student's t-test and by the general linear model with adjustment for age and gender at a P value of 0.05.
†Total serum IgE levels < 300 kU/l were considered in the normal range and specific IgE levels ≥ 0.35 kUA/l by CAP assay were considered positive.

